![]()
Overview
This is a library to help people that understand JavaScript to leverage for using Jupyter with the iJavaScript kernel as a way to load and explore data, and ultimately tell compelling stories with visuals.
Jupyter is a way to programmatically explore a subject and interleave text and markdown to make Data Driven Documents.
See the #Installation section for requirements and installation
Notebooks are a way to explore and experiment, in addition to write and explain ideas.
All of the tutorials provided here, including this one, was written as a notebook and simply exported.
The document itself is a list of cells that can be either:
- Text or Markdown (like this)
- Or executable Code (NodeJS code in this case)
- rendering images, interactive charts, maps or even generated text based on data.
note: You can choose whether to show the code or simply show the results.
This Library helps with the Coding Side of Things
The jupyter-ijavascript-utils library is simply a collection of utility methods for Node and JavaScript Developers interested in Data Science.
- Load
- (ex: module:file, module:datasets or the Getting Data tutorial)
- Manipulate and Refine
- (ex: module:array, module:object, or module:set)
- Aggregate, Manipulate and Explore
- (ex: module:group, module:aggregate or the Grouping / DataFrames tutorial)
- Format / Visualize
- (ex: module:format, module:vega, or the Visualization tutorial)
- Export
- (ex: TableGenerator, or the Generating Tables and Exporting tutorial)
Currently, we assume you'll be using nriesco's iJavaScript Jupyter Kernel and the Jupyter Lab - the latest interface for Jupyter - and the installation is fairly simple in the How to Use guide. (Although suggestions welcome)
This is not intended to be the only way to accomplish many of these tasks, and alternatives are mentioned in the documentation as available.
Running on Binder
mybinder.org is a great place to run a Jupyter Notebook online.
It means you can run Jupyter Notebooks with additional kernels without having to install anything, and can try right in your browser.
Give it a try here:
![]()
NOTE - iJavaScript Stalemate
iJavaScript currently requires node v20 to run, and fails on versions higher due to zeromq issues See bug 297 on iJavaScript
Additionally, vega has now moved to ESM Modules - vega versions, and vega-lite versions
iJavaScript only supports ESM Modules with esm-hook - see issue 210
What's New
- 1.65 - update module type to explicitly state commonJS
- 1.64 - using the latest version of vega/vega-lite prior to ESM update
- 1.62 - Update to Array.peekableIterator to include peekItr() as sugar for .peek
- 1.61 - Docs Updated
- 1.60 - Make post-processing of documents easier with ijs.markDocumentPosition
- 1.59 -
- #95 - give control with page breaks. So we can render text before the page break (like for headers) - or even get the html used and render it how we want. (ex: ijs.printPageBreak)
- #96 - Support ijs.internalComment in notebooks (meaning it can render in markdown, but can be disabled when preparing to print)
- 1.58 -
- #91 - add splitIntoDatums(collection, fieldsToSplitBy) - to make working with datum libraries - like vega-lite - easier
- #92 - make using the cache easier for file.useCache() - as you can say to use the cache, and it will still work if the cache file does not exist yet.
- #93 / #94 - bug fixes
- 1.57 - #86 - include examples on binning based on time series see more here
- #87 - add in file.fileExists to make things easier for new people getting started
- #89 - allow array.resize to work with defaults, if zipping arrays of different sizes
- #90 - correct issue with timezone offsets, so it is no longer possible to get a timezone offset +24:00 from any of the localizations - like date.toLocalISO
- #92 - make it easier to handle big expensive calculations with a cache, see ijs.useCache() and file.useCache()
- 1.56 - #84 (object.renamePropertiesFromList), #82 (date.getWeekday)
- 1.55 - #76, #77, #74, #78
- 1.54 - additional Date logic, and formatting. #70 #71 #72
- 1.53 - additional docs and examples for color/colour package.
- 1.52 - print a date to ISO in local time with date.toLocalISO
- 1.51 - added in date - and addressed issue #69, #68, #67, #66
- 1.50 - added in color/colour - and addressed issue #65
- 1.49 - Additional documentation for issues #18, #63, #62, #61 (like table.generateObjectCollection)
- 1.48 - Correct table rendering html if filter was used (#64)
- 1.47
- allow conversion from a Collection of Objects to Arrays and back with object. (object.objectCollectionFromArray, object.objectCollectionToArray)
- Easier iterating over values and peeking with array with PeekableArrayIterator
- Support for delayed and asynchronous chaining of functions (delayedFn, chainFunctions, etc)
- 1.46 - Make it easier to extract data from "hard-spaced arrays" - module:array.multiLineSubstr, module:array.multiStepReduce
- 1.45 - more ways to understand the data - aggregate.coalesce(), convert properties to arrow/dot notation / reverse it object.flatten() / object.expand() and object.isObject()
- 1.43 - esm module fix since still not supported yet in ijavascript
- 1.41 - object.propertyInherit - to simplify inheriting values from one record to the next
- 1.40 - array.extract and array.applyArrayValues to allow for extracting values from arrays, transforming them on a separate process and applying them deeply and safely
- 1.39 - format.exportWords - to identify distinct words in strings using unicode character properties
- 1.38 - object.extractObjectProperty / object.applyPropertyValue to allow for extracting values from arrays, transforming them on a separate process and applying them back
- 1.37 - format.replaceString as convenience for replacing only a single string.
- 1.36 - format.replaceStrings to allow for replacement dictionaries and tuplets
- 1.35 - extractObjectProperties / extractObjectProperty - to do horizontal transposes on objects
- 1.34 - format.mapArrayDomain and add notes in the header of random on using non-uniform distributions.
- 1.33 - Object.augmentInherit and Object.union
- 1.32 - Array.indexify to identify sections within a 1d array into a hierarchy.
- 1.31 - harden Array.transpose for arrays with nulls, and Table.generateTSV
- 1.30 - add Format.wordWrap and Format.lineCount
- 1.29 - Updated TableGenerator.format method
- 1.28 - Sticky table headers for table.render
- 1.27 - Multi-Dimensional arange (initialize array along multiple dimensions)
- 1.26 - Support for file.writeFile and file.writeJSON to append
- 1.25 - Additional chain methods and documentation
- 1.24 - format.stripHtmlTags, TableGenerator.offset, chain.chainFlatMap, chain.chainFilter
- 1.23 - add format.parseNumber and TableGenerator.styleColumn, align group.separateByFields to vega-lite fold transform
- 1.22 - make chain iJavaScript aware, but still able to work outside of Jupyter
- 1.21 - include chain - simple monoid
- 1.20 - fix vega dependency
- 1.19 - add in describe and hashMap modules, along with format.limitLines
- 1.18 - tie to vega-datasets avoiding esmodules until ijavascript can support them
- 1.17 - provide object.propertyValueSample - as a way to list 'non-empty' property values
- 1.16 - provide file.matchFiles - as a way to find files or directories
- 1.15 - provide object.formatProperties - as a way to quickly convert to string, number, etc.
- 1.14 - provide object.mapProperties() and format.compactNumber()
- 1.13 - provide utils.random() to genrate random values
- 1.12 - provide
utils.table(...)instead ofnew utils.TableGenerator(...) - 1.11 - provide topValues (like top 5, bottom 3)
- 1.10 - provide percentile (like 50th percentile) aggregates
- 1.9 - allow transposing results on TableGenerator.
- 1.8 - add in What can I Do tutorial, and object.join methods
- 1.7 - revamp of
animationmethod for ijs.htmlScript - 1.6 - add SVG support for rendering SVGs and animations with module:svg.
- 1.5 - Add LaTeX / KaTeX support with module:latex for rendering Math formulas and PlantUML support for Diagrams
- 1.4 - Add in vega embed, vega mimetypes with module:vega and example choropleth tutorial
- 1.3 - Add Leaflet for Maps, allow Vega to use explicit specs (so Examples can be copied and pasted, and add in htmlScripts
Module Overview
| Export | Description |
|---|---|
| module:aggregate | Aggregate collections or collections of objects (ex: min, max, unique, contains, etc. |
| module:array | Massage, sort, reshape arrays. |
| module:base64 | Convert to and from base64 encoding of strings |
| module:chain | Simple wrapper (Monad-ish) that allows for chaining statements together |
| module:datasets | Load example datasets provided by the vega team |
| module:describe | Similar to Pandas describe, provides statistics on a set of values / objects |
| module:file | Read and write data/text to files. |
| module:format | Formatting and massage data to be legible. |
| module:group | Group/Reduce Hierarchies of Object - generating Maps of records (SourceMap) |
| module:hashMap | Modify JavaScript HashMaps (ex new Map()) |
| module:ijs | Extend iJavaScript to support await, and new types of rendering - like htmlScript and markdown |
| module:latex | Render Math Notation with LaTeX and KaTeX |
| module:leaflet | Render maps with Leaflet |
| module:object | Massage and manipulate Objects or Collections of Objects. |
| module:plantuml | Render PlantUML within Jupyter results. |
| module:random | Generate random values, pick from arrays, or create natural looking images based on 2d/3d space. |
| module:set | Functional Utilities for managing JavaScript Sets - allowing for chaining. |
| module:svg | Programmatically create SVGs (either jupyter side for exports, or client side for animations) |
| module:vega | Generate Charts / Graphs / Maps with Vega and Vega-Lite |
| SourceMap | SubClass of Maps - generated by the module:group and reducible with module:aggregate |
| TableGenerator | Class that can filter, sorts, manage and then generate HTML, CSV, Markdown, etc. |
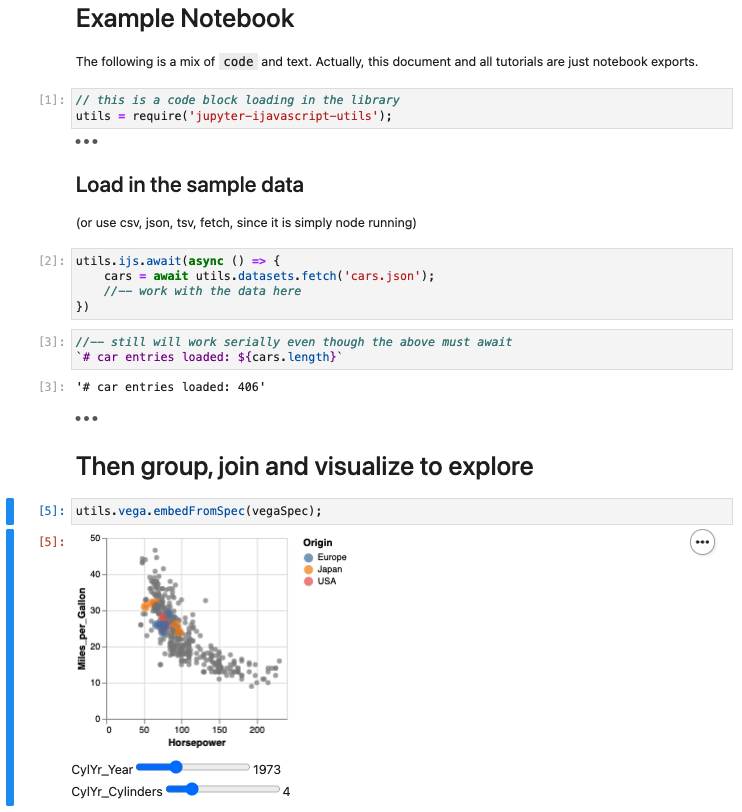
For Example
Get Sample Data
(See the DataSets module for more on sample datasets)
(See the ijs module for helpers to use async/await)
//-- get the data
utils.ijs.await(async ($$, console) => {
	barley = await utils.datasets.fetch('barley.json');

	//-- continue to use the barley dataset, or wait to the next cell
});
Group By
Then we can group using a process similar to d3js
(see the Group module for more on grouping)
//-- get the min max of the types of barley
barleyByVarietySite = utils.group.by(barley, 'variety', 'site')

// SourceMap(10) [Map] {
//   'Manchuria' => SourceMap(6) [Map] {
//     'University Farm' => [ [Object], [Object] ],
//     'Waseca' => [ [Object], [Object] ],
//     'Morris' => [ [Object], [Object] ],
//     'Crookston' => [ [Object], [Object] ],
//     'Grand Rapids' => [ [Object], [Object] ],
//     'Duluth' => [ [Object], [Object] ],
//     source: 'site'
//   },
//   'Glabron' => SourceMap(6) [Map] {
//     'University Farm' => [ [Object], [Object] ],
//     'Waseca' => [ [Object], [Object] ],
//     'Morris' => [ [Object], [Object] ],
//     'Crookston' => [ [Object], [Object] ],
//     'Grand Rapids' => [ [Object], [Object] ],
//     'Duluth' => [ [Object], [Object] ],
//     source: 'site'
//   },
//   ...
// }

//-- now group by variety and year
barleyByVarietyYear = utils.group.by(barley, 'variety', 'year')

// SourceMap(10) [Map] {
//   'Manchuria' => SourceMap(2) [Map] {
//     1931 => [ [Object], [Object], [Object], [Object], [Object], [Object] ],
//     1932 => [ [Object], [Object], [Object], [Object], [Object], [Object] ],
//     source: 'year'
//   },
//   'Glabron' => SourceMap(2) [Map] {
//     1931 => [ [Object], [Object], [Object], [Object], [Object], [Object] ],
//     1932 => [ [Object], [Object], [Object], [Object], [Object], [Object] ],
//     source: 'year'
//   },
//   ...
// }
Aggregating
(See the Aggregation module for more)
utils.group.by(barley, 'variety', 'site')
    .reduce((collection) => ({
        years: utils.aggregate.extent(collection, 'year'),
        numRecords: utils.aggregate.length(collection),
        yield_sum: utils.aggregate.sum(collection, 'yield'),
        yield_min: utils.aggregate.min(collection, 'yield'),
        yield_max: utils.aggregate.max(collection, 'yield'),
        yield_diff: utils.aggregate.difference(collection, 'yield')
    }));

returns
[
  {
    variety: 'Manchuria',
    site: 'University Farm',
    years: { min: 1931, max: 1932 },
    numRecords: 2,
    yield_sum: 53.9,
    yield_min: 26.9,
    yield_max: 27,
    yield_diff: 0.100
  },
  {
    variety: 'Manchuria',
    site: 'Waseca',
    years: { min: 1931, max: 1932 },
    numRecords: 2,
    yield_sum: 82.33333,
    yield_min: 33.46667,
    yield_max: 48.86667,
    yield_diff: 15.39999
  },
  ...
];
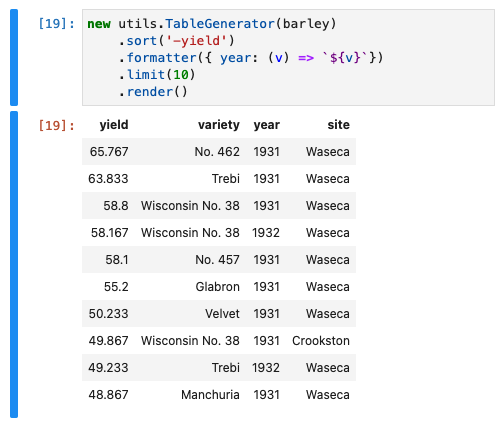
Render as a Table
(See the TableGenerator class for more)
new utils.TableGenerator(barley)
    .sort('-yield')
    .formatter({ year: (v) => `${v}`})
    .limit(10)
    .render()
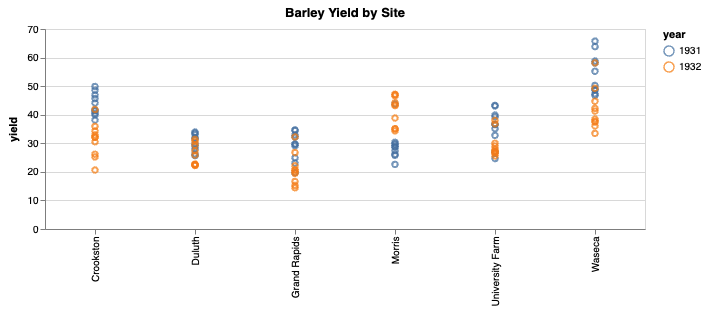
Show a Graph
(See the Vega-Lite tutorial or the Vega module for more)
//-- make a point chart
utils.vega.svg((vl) => vl.markPoint()
    //-- data as an array of items
    .data(barley)
    .title('Barley Yield by Site')
    .width(600)
    .encode(
        //-- x position is Nominal - not a number
        vl.x().fieldN('site'),
        //-- y position is Quantitative - a number
        vl.y().fieldQ('yield'),
        //-- Color is based on the year field
        vl.color().fieldN('year')
    )
)
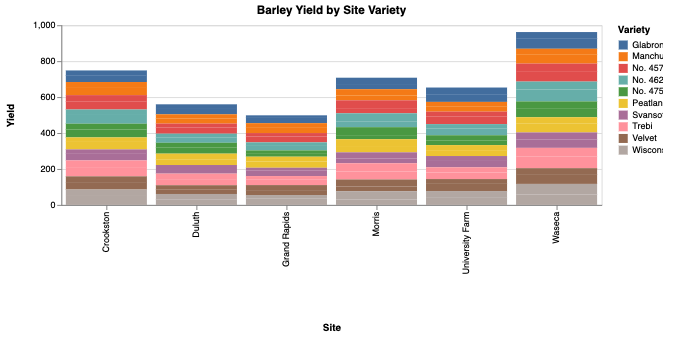
Where making it into a bar chart, to understand the proportions of varieties grown is simply changing the mark type
// change from markPoint to markBar
utils.vega.svg((vl) => vl.markBar()
    //-- data as an array of items
    .data(barley)
    .title('Barley Yield by Site Variety')
    .width(600)
    .encode(
        //-- x position is Nominal - not a number
        vl.x().fieldN('site').title('Site'),
        //-- y position is Quantitative - a number
        vl.y().fieldQ('yield').title('Yield'),
        //-- Color is based on the variety field
        vl.color().fieldN('variety').title('Variety')
    )
)
With further options to zoom, pan, or setup interactive sliders:
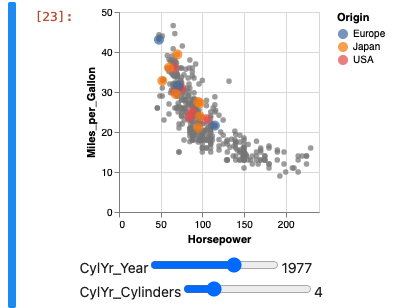
Or try your hand at the Vega Lite Examples and more from module:vega
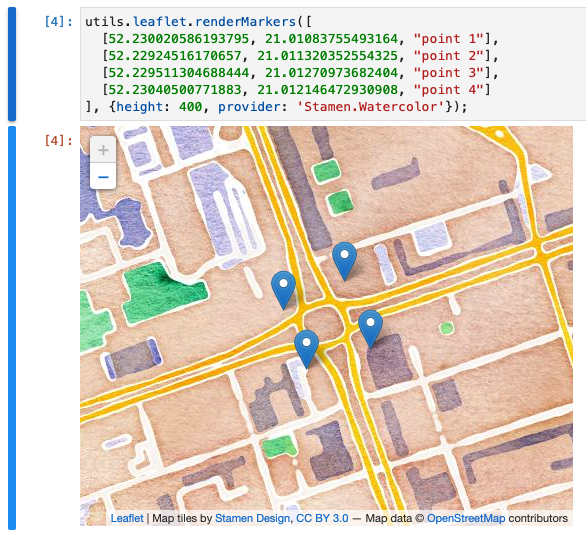
Create a Data Driven Map
(See the Let's make a Data Driven Map tutorial for more)

Render Maps
(See the Leaflet module for more)
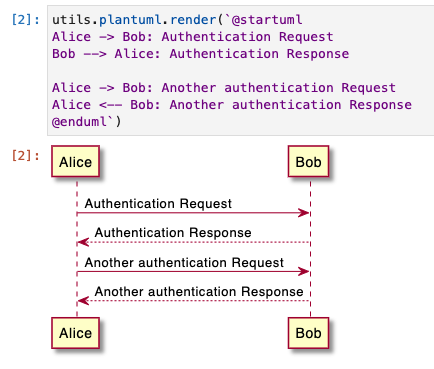
Generate Text Driven Diagrams
(See the PlantUML module for more)
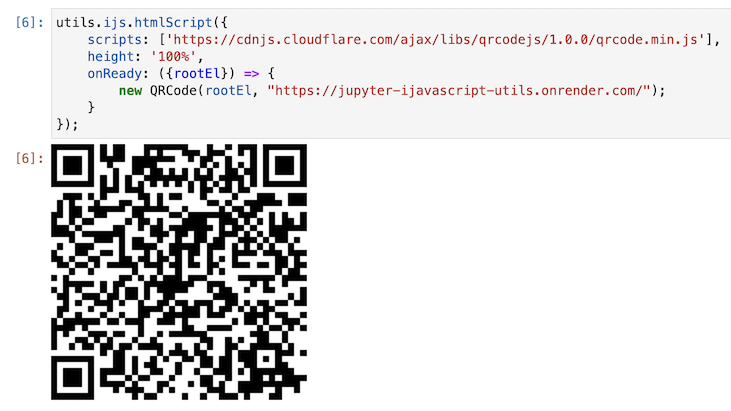
Render Other Libraries
(See the htmlScript tutorial for more)
utils.ijs.htmlScript({
    scripts: ['https://cdnjs.cloudflare.com/ajax/libs/qrcodejs/1.0.0/qrcode.min.js'],
    height: '100%',
    onReady: ({rootEl}) => {
        new QRCode(rootEl, "https://jupyter-ijavascript-utils.onrender.com/");
    }
});
Create Animations
(See the Noise Visualization tutorial or svg module for more)


Install
Note that some of the utilities assumes you are running within Jupyter - within n-riesco's iJavaScript kernel (that provides JavaScript language support within Jupyter)
npm install jupyter-ijavascript-utils
Depends on:
See the How to Use section for more.
Common Questions
Converting Local Functions to a Local Library
Often - Jupyter is not the best place to do development, and folks would like to develop in their own favourite IDE.
You can write local modules (ex: lib.js) relative to your notebook, and then use require('./lib') to access them in your notebook. (see the section below on ESM Modules)
NOTE: re-running the require will use a cached version of your module, and may not reflect changes you just made.
(For this and other reasons, it can be helpful to have a version attribute to your module - to ensure the latest code is accessible)
There typically are two options:
-
re-run the entire notebook
-
use a "cache bypass" only for your local library. ex: import-fresh
Using a cache bypass is fairly simple, and behaves something similar to this:
utils = reqire('jupyter-ijavascript-utils');
importFresh = require('import-fresh');
// other imports go here

//-- clear the output so it doesn't pollute with nonsense we don't care about.
utils.ijs.clearOutput();
and then load your module in a separate cell:
lib = importFresh('./lib');
lib.version; // 1.0.0
and if you change your library, you can then just run that cell again
ESM Modules + D3
Note that we strongly recommend using this with other modules like D3 - that only support ESM modules now.
There is a known issue #210 in the iJavaScript kernel.
So if you try to import libraries like d3 and get comments like this
$ node -e "import defaultExport from './test.mjs'"
[eval]:1
import defaultExport from './test.mjs'
^^^^^^

SyntaxError: Cannot use import statement outside a module
    at new Script (vm.js:88:7)
    at createScript (vm.js:263:10)
    at Object.runInThisContext (vm.js:311:10)
    at Object.<anonymous> ([eval]-wrapper:10:26)
    at Module._compile (internal/modules/cjs/loader.js:1151:30)
    at evalScript (internal/process/execution.js:94:25)
    at internal/main/eval_string.js:23:3
Use esm-hook as a workaround for now.
require("esm-hook"); // must come before requiring esm modules
d3 = require('d3');  // import esm modules
More is found on the documentation for issue #210