Helper for working with Vega-Lite (and Vega) within iJavaScript notebooks.
(Vega-Lite-Api: creates -> Vega-Lite JSON specifications: creates -> Vega charting specifications: using -> D3 as a visualization kernel)
-
Rendering directly as SVG within Jupyter
- vega.svg((vl) => vl) - to render a chart as SVG directly in Jupyter - using the vega-lite-api
- vega.svgFromSpec(Object | String) - rendering a chart directly in Jupyter - using a vega-lite specification
- vega.svgFromSpec(Object | String) - renders a chart directly in Jupyter - using a vega specificiation
-
Rendering as HTML / JavaScript through ijs.htmlScript()
- vega.embed((vl) => vl) - to render a chart in the browser - using the vega-lite-api
- vega.embedFromSpec(Object | String) - rendering a chart in the browser - using a vega-lite specification
- vega.embedFromVegaSpec(Object | String) - renders a chart in the browser - using a vega specificiation
-
Rendering specifications through the Jupyter Lab mime-type
- vega.vegaMimeType(Object | String) - render the chart using the Vega mime-type (as png)
- vega.vegaLiteMimeType(Object | String) - render the chart using the Vega-Lite mime-type (as png)
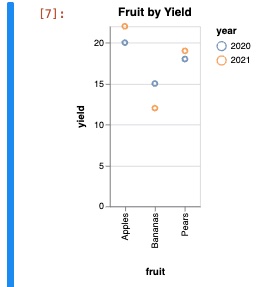
For example, this is a very simple demonstration for writing a vega-lite chart (the simplest way to get started)
 simpleData = [{fruit:'Apples',yield:20,year:'2020'},{fruit:'Apples',yield:22,year:'2021'},
   {fruit:'Bananas',yield:15,year:'2020'},{fruit:'Bananas',yield:12,year:'2021'},
   {fruit:'Pears',yield:18,year:'2020'},{fruit:'Pears',yield:19,year:'2021'}];

 utils.vega.svg(
 // accept the reference to the vega-lite instance passed
 (vl) => vl
   // render as points
   .markPoint()
       // use simpleData as the data source
       .data(simpleData)
       // title
       .title('Fruit by Yield')
       .width(100)
       .encode(
           // define the x axis as the Qualitative / Numerical 'yield' property
           vl.y().fieldQ('yield'),
           // define the y axis as the Nominative / TextBased 'fruit' property
           vl.x().fieldN('fruit'),
           // define the color series based on the Qualitative / Numerical 'year' property
           vl.color().fieldN('year')
       )
 );
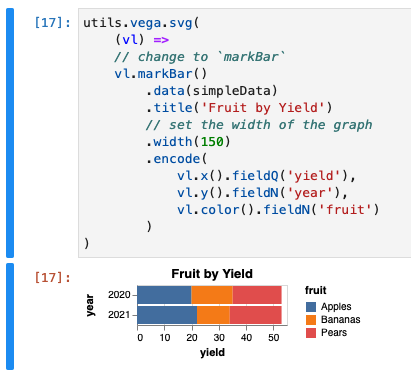
and with simple changes, convert it to a bar graph
- Check out the Vega-Lite tutorials
- See the excellent Vega-Lite-API Observable Notebooks and Jeffrey Heer's Curriculum
- or see the Vega-Lite Examples and Vega Examples
- and of course the documentation is available: Vega-Lite-API, Vega-Lite, Vega
What is Vega-Lite / Vega-Lite-API?
Vega-Lite is a charting library that provides a great deal of flexibility and interaction
while also allowing for very simple use cases
(and further simplified with Vega-Lite-Api)

It is built on Vega that uses d3 as a visualization kernel.
Note that Vega-Lite is supported by two options within this library:
- through the vega-lite JSON specification - a high level grammar that creates
- vega.embed((vl) => vl) - to render a chart in the browser - using the vega-lite-api
- vega.svg((vl) => vl) - to render a chart as SVG directly in Jupyter - using the vega-lite-api
- through the vega-lite-api - a JavaScript api to write the vega-lite specifications
- vega.embedFromSpec(Object | String) - rendering a chart in the browser - using a vega-lite specification
- vega.svgFromSpec(Object | String) - rendering a chart directly in Jupyter - using a vega-lite specification
(Where svg renders directly in Jupyter, and embed uses ijs.htmlScript() to render)
Note that rendering in the browser (as html / javascript), will provide more interactivity options (like export options) while also having consequences in exporting the notebook in some cases.
What is Vega?
True Vega is also supported, providing support for additional capabilities (that to my knowledge cannot be done with vega-lite) such as Radar Charts, Contour Plots, Tree Layouts, Force Plots, and others.
However Vega does not have a JavaScript API:
- vega.embedFromVegaSpec(Object | String) - renders a chart in the browser - using a vega specificiation
- vega.svgFromSpec(Object | String) - renders a chart directly in Jupyter - using a vega specificiation

In the context of Notebooks - is expected that Vega-Lite will be sufficient for most cases.
Embedding vs SVG
SVG versions of charts render directly within Jupyter Notebook (as svg output)
(As a rule - embed... calls and svg... calls can be easily interchanged)
Embedding means the charts run within the browser (through dynamic HTML in the output).
This provides greater flexibility (at the consequence of complexity of splitting computation between jupyter and browser)
As opposed to the SVG version, we can now:
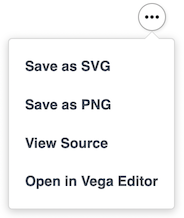
- use vega-embed allowing for downloading of the chart
 ;
;
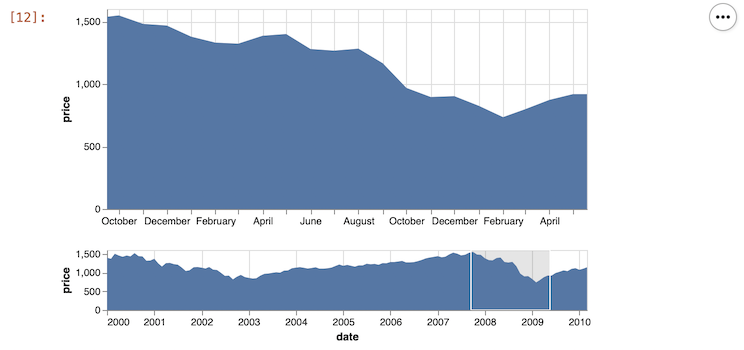
- support for interactions and interactive dashboards
utils.vega.svgFromSpec({
  "$schema": "https://vega.github.io/schema/vega-lite/v5.json",
  "data": {"url": "https://vega.github.io/vega-lite/examples/data/sp500.csv"},
  "vconcat": [{
    "width": 480,
    "mark": "area",
    "encoding": {
      "x": {
        "field": "date",
        "type": "temporal",
        "scale": {"domain": {"param": "brush"}},
        "axis": {"title": ""}
      },
      "y": {"field": "price", "type": "quantitative"}
    }
  }, {
    "width": 480,
    "height": 60,
    "mark": "area",
    "params": [{
      "name": "brush",
      "select": {"type": "interval", "encodings": ["x"]}
    }],
    "encoding": {
      "x": {
        "field": "date",
        "type": "temporal"
      },
      "y": {
        "field": "price",
        "type": "quantitative",
        "axis": {"tickCount": 3, "grid": false}
      }
    }
  }]
});
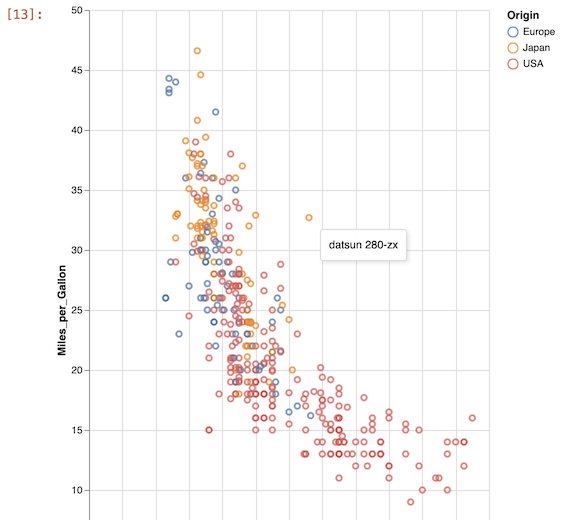
- support for tooltips within the Jupyter cell
utils.vega.embedFromSpec({
  "$schema": "https://vega.github.io/schema/vega-lite/v5.json",
  "description": "A scatterplot showing horsepower and miles per gallons that opens a Google search for the car that you click on.",
  "data": {"url": "https://vega.github.io/vega-lite/examples/data/cars.json"},
  "height": 600,
  "width": 400,
  "mark": "point",
  "transform": [{
    "calculate": "'https://www.google.com/search?q=' + datum.Name", "as": "url"
  }],
  "encoding": {
    "x": {"field": "Horsepower", "type": "quantitative"},
    "y": {"field": "Miles_per_Gallon", "type": "quantitative"},
    "color": {"field": "Origin", "type": "nominal"},
    //-- simply by adding the tooltip encoding here
    "tooltip": {"field": "Name", "type": "nominal"},
    "href": {"field": "url", "type": "nominal"}
  }
});
or through the vega lite
FAQ
The following are a series of common questions / issues, put here for visibility.
Passing Objects to vega-lite-api
Note that there are some things that are not supported by the vega-lite-api
(such as grouping)
This is only a problem with the vega-lite-api, as it writes the spec used for vega-lite
In these cases, you can send an object within many of the methods, as it no longer needs to translate how that object should look.
(like sending mark( type:'bar') instead of .markBar() - to allow for tooltips
or passing an object to encode to support grouping)
simpleData = [{fruit:'Apples',yield:20,year:'2020'},{fruit:'Apples',yield:22,year:'2021'},
  {fruit:'Bananas',yield:15,year:'2020'},{fruit:'Bananas',yield:12,year:'2021'},
  {fruit:'Pears',yield:18,year:'2020'},{fruit:'Pears',yield:19,year:'2021'}];

utils.vega.svg((vl) => vl
  // render as points
  .mark({ type: 'bar', tooltip: true})
  .data(simpleData)
  .title('Fruit by Yield')
  .width(100)
  .encode({
    "x": {"field": "fruit"},
    "y": {"field": "yield", "type": "quantitative"},
    "xOffset": {"field": "year"},
    "color": {"field": "year"}
  })
);
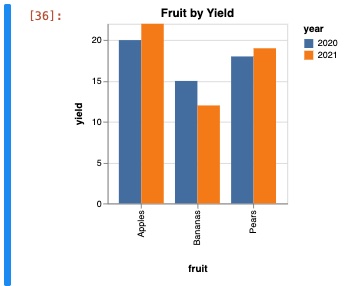
Chart Series
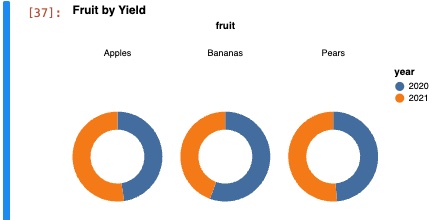
Instead of grouping values, you can also create a series of charts instead.
utils.vega.svg((vl) => vl
  // render as points
  .mark({ type: 'arc', innerRadius: 30, tooltip: true})
      .data(simpleData)
      .title('Fruit by Yield')
      .width(100)
      .encode(
        // define the arc on the graph with the Qualitative / Numerical 'yield' property
        vl.theta().fieldQ('yield'),
        // define the y axis as the based on the Qualitative / Numerical 'year' property
        vl.color().fieldN('year'),
        // define the color series Nominative / TextBased 'fruit' property
        vl.column().fieldN('fruit')
      )
);
Other examples can be found under the vega-lite examples and rendered with svgFromSpec or embedFromSpec
Object Formatting / Conversion
Note that vega-lite examples use data at the mark level:
[{fruit:'Apples',yield:20,year:'2020'},{fruit:'Apples',yield:22,year:'2021'},
  {fruit:'Bananas',yield:15,year:'2020'},{fruit:'Bananas',yield:12,year:'2021'},
  {fruit:'Pears',yield:18,year:'2020'},{fruit:'Pears',yield:19,year:'2021'}];
not at the series level:
[{ year:'2020', apples:20, bananas:15, pears:18 },
 { year:'2021', apples:22, bananas:12, pears:19 }];
If your data is at the series level, you can:
- Transform the data with the group.separateByFields
- utils.group.separateByFields(fruitSeriesData, 'apples', 'bananas', 'pears');
- this makes a new field called 'key' that will have values of either apples, bananas or pears
- or using the vega-lite fold transform
- by adding in the
.transform()into the spec - like below
- by adding in the
fruitSeriesData = [{ year:'2020', apples:20, bananas:15, pears:18 },
  { year:'2021', apples:22, bananas:12, pears:19 }];

utils.vega.svg((vl) => vl
  .mark({ type: 'arc', innerRadius: 30, tooltip: true})
    .data(fruitSeriesData)

    //-- apples, bananas and pears will now be separate records
    //-- with the new `key` field as either 'apple', 'banana', or 'pears'
    //-- and the new `value` field storing the value of those fields.
    .transform([{ fold: ['apples', 'bananas', 'pears']}])

    .title('Fruit by Yield')
    .width(100)
    .encode(
      // define the arc on the graph with the Qualitative / Numerical 'yield' property
      vl.theta().fieldQ('value'),
      // define the y axis as the Nominative / TextBased 'fruit' property
      vl.color().fieldN('year'),
      // define the color series based on the Qualitative / Numerical 'year' property
      vl.column().fieldN('key')
    )
)

For more:
- Check out the Vega-Lite tutorials
- See the excellent Vega-Lite-API Observable Notebooks and Jeffrey Heer's Curriculum
- or see the Vega-Lite Examples and Vega Examples
Methods
(static) embed(fn, display)
Renders a vega-lite diagram within ijs.htmlScript (browser).
Unlike vega.svg() - this renders with ijs.htmlScript (html)
Please note that svg... and embed... calls are meant to be easily interchangable.
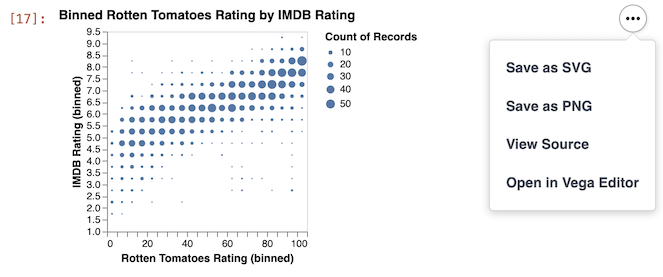
vl.embed((vl) => vl.markCircle()
  .title('Binned Rotten Tomatoes Rating by IMDB Rating')
  .data(movies)
  .encode(
    vl.x().fieldQ('Rotten Tomatoes Rating').bin({maxbins: 20}),
    vl.y().fieldQ('IMDB Rating').bin({maxbins: 20}),
    vl.size().count()
  ));
See the Vega-Lite tutorial.
Parameters:
| Name | Type | Description | ||||||
|---|---|---|---|---|---|---|---|---|
fn |
function | function of type (vl) => {encodedVegaLite) that returns the vega lite instance encoded for a graph Properties
|
||||||
display |
Display | the iJavaScript Display. (Note: $$ refers to the current display within the iJavaScript kernel) See the NEL documentation for more |
(static) embedFromSpec(vegaSpec, display)
Renders a vega-lite chart from a JSON / Object specification.
Unlike vega.svgFromSpec() - this renders with ijs.htmlScript (html)
You can either pass directly the Schema Objects (ex: parsed JSON from the vega lite examples)
Such as this one for bar charts
sampleData = [
  {"a": "A", "b": 28}, {"a": "B", "b": 55}, {"a": "C", "b": 43},
  {"a": "D", "b": 91}, {"a": "E", "b": 81}, {"a": "F", "b": 53},
  {"a": "G", "b": 19}, {"a": "H", "b": 87}, {"a": "I", "b": 52}
];
utils.vega.embedFromSpec(
{
  "$schema": "https://vega.github.io/schema/vega-lite/v5.json",
  "description": "A simple bar chart with embedded data.",
  "data": {
    "values": sampleData
  },
  "mark": "bar",
  "encoding": {
    "x": {"field": "a", "type": "nominal", "axis": {"labelAngle": 0}},
    "y": {"field": "b", "type": "quantitative"}
  }
});
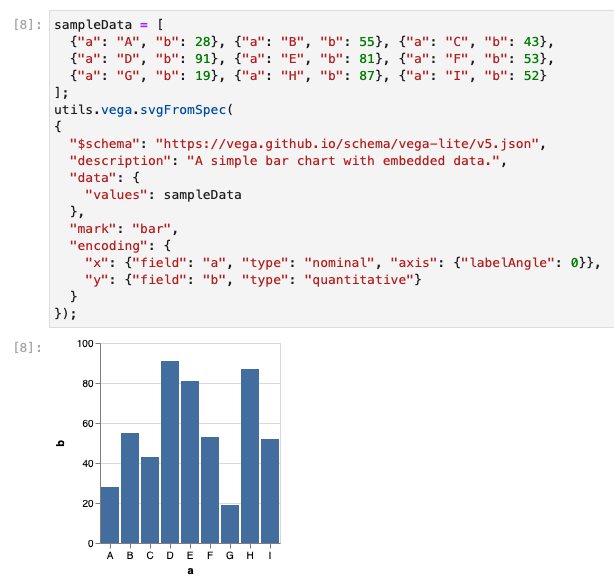
... or the strings directly from the vega lite examples.
utils.vega.embedFromSpec(`
{
  "$schema": "https://vega.github.io/schema/vega-lite/v5.json",
  "description": "A simple bar chart with embedded data.",
  ...
}`)
Parameters:
| Name | Type | Description |
|---|---|---|
vegaSpec |
String | Vega string specification |
display |
Display | the iJavaScript display |
(static) embedFromVegaSpec(spec)
Renders an Vega (not Vega-lite) chart from a JSON / Object specification.
Unlike vega.svgFromVegaSpec() - this renders with ijs.htmlScript (html)
Similar to vega.svgFromSpec(), the specification can either be an object or JSON encoded string.
This example is from the Vega Line Chart example
utils.vega.embedFromVegaSpec({
  "$schema": "https://vega.github.io/schema/vega/v5.json",
  "description": "A basic line chart example.",
  "width": 500,
  "height": 200,
  "padding": 5,

  "signals": [
    {
      "name": "interpolate",
      "value": "linear",
      "bind": {
        "input": "select",
        "options": [
          "basis",
          "cardinal",
          "catmull-rom",
          "linear",
          "monotone",
          "natural",
          "step",
          "step-after",
          "step-before"
        ]
      }
    }
  ],

  "data": [
    {
      "name": "table",
      "values": [
        {"x": 0, "y": 28, "c":0}, {"x": 0, "y": 20, "c":1},
        {"x": 1, "y": 43, "c":0}, {"x": 1, "y": 35, "c":1},
        {"x": 2, "y": 81, "c":0}, {"x": 2, "y": 10, "c":1},
        {"x": 3, "y": 19, "c":0}, {"x": 3, "y": 15, "c":1},
        {"x": 4, "y": 52, "c":0}, {"x": 4, "y": 48, "c":1},
        {"x": 5, "y": 24, "c":0}, {"x": 5, "y": 28, "c":1},
        {"x": 6, "y": 87, "c":0}, {"x": 6, "y": 66, "c":1},
        {"x": 7, "y": 17, "c":0}, {"x": 7, "y": 27, "c":1},
        {"x": 8, "y": 68, "c":0}, {"x": 8, "y": 16, "c":1},
        {"x": 9, "y": 49, "c":0}, {"x": 9, "y": 25, "c":1}
      ]
    }
  ],

  "scales": [
    {
      "name": "x",
      "type": "point",
      "range": "width",
      "domain": {"data": "table", "field": "x"}
    },
    {
      "name": "y",
      "type": "linear",
      "range": "height",
      "nice": true,
      "zero": true,
      "domain": {"data": "table", "field": "y"}
    },
    {
      "name": "color",
      "type": "ordinal",
      "range": "category",
      "domain": {"data": "table", "field": "c"}
    }
  ],

  "axes": [
    {"orient": "bottom", "scale": "x"},
    {"orient": "left", "scale": "y"}
  ],

  "marks": [
    {
      "type": "group",
      "from": {
        "facet": {
          "name": "series",
          "data": "table",
          "groupby": "c"
        }
      },
      "marks": [
        {
          "type": "line",
          "from": {"data": "series"},
          "encode": {
            "enter": {
              "x": {"scale": "x", "field": "x"},
              "y": {"scale": "y", "field": "y"},
              "stroke": {"scale": "color", "field": "c"},
              "strokeWidth": {"value": 2}
            },
            "update": {
              "interpolate": {"signal": "interpolate"},
              "strokeOpacity": {"value": 1}
            },
            "hover": {
              "strokeOpacity": {"value": 0.5}
            }
          }
        }
      ]
    }
  ]
});
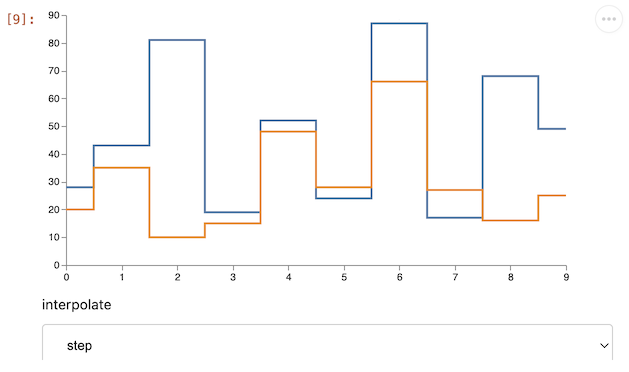
Parameters:
| Name | Type | Description |
|---|---|---|
spec |
String | Object | Vega specification |
(static) svg(fn, display)
Renders a svg of a vega lite diagram directly within Jupyter
Unlike vega.embed() - this renders directly within Jupyter.
vl.svg((vl) => vl.markCircle()
  .title('Binned Rotten Tomatoes Rating by IMDB Rating')
  .data(movies)
  .encode(
    vl.x().fieldQ('Rotten Tomatoes Rating').bin({maxbins: 20}),
    vl.y().fieldQ('IMDB Rating').bin({maxbins: 20}),
    vl.size().count()
  ));
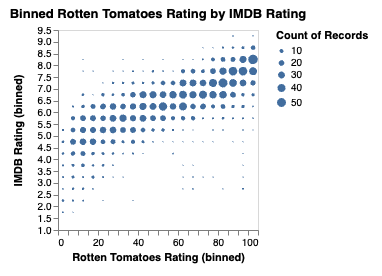
See the Vega-Lite tutorial.
Parameters:
| Name | Type | Description | ||||||
|---|---|---|---|---|---|---|---|---|
fn |
function | function of type (vl) => {encodedVegaLite) that returns the vega lite instance encoded for a graph Properties
|
||||||
display |
Display | the iJavaScript Display. (Note: $$ refers to the current display within the iJavaScript kernel) See the NEL documentation for more |
(static) svgFromSpec(vegaSpec, display)
Renders a vega-lite chart from a JSON / Object specification.
Unlike vega.embedFromSpec() - this renders directly within Jupyter.
Such as this one for bar charts from the vega lite examples
You can either pass the Schema as:
- parsed JSON Objects (allowing for sending NodeJS data and config)
- or as a JSON encoded string
Parsed JSON
sampleData = [
  {"a": "A", "b": 28}, {"a": "B", "b": 55}, {"a": "C", "b": 43},
  {"a": "D", "b": 91}, {"a": "E", "b": 81}, {"a": "F", "b": 53},
  {"a": "G", "b": 19}, {"a": "H", "b": 87}, {"a": "I", "b": 52}
];
utils.vega.svgFromSpec(
{
  "$schema": "https://vega.github.io/schema/vega-lite/v5.json",
  "description": "A simple bar chart with embedded data.",
  "data": {
    "values": sampleData
  },
  "mark": "bar",
  "encoding": {
    "x": {"field": "a", "type": "nominal", "axis": {"labelAngle": 0}},
    "y": {"field": "b", "type": "quantitative"}
  }
});

- JSON encoded String
utils.vega.svgFromSpec(`
{
  "$schema": "https://vega.github.io/schema/vega-lite/v5.json",
  "description": "A simple bar chart with embedded data.",
  "data": {
    "values": [
      {"a": "A", "b": 28}, {"a": "B", "b": 55}, {"a": "C", "b": 43},
      {"a": "D", "b": 91}, {"a": "E", "b": 81}, {"a": "F", "b": 53},
      {"a": "G", "b": 19}, {"a": "H", "b": 87}, {"a": "I", "b": 52}
    ]
  },
  "mark": "bar",
  "encoding": {
    "x": {"field": "a", "type": "nominal", "axis": {"labelAngle": 0}},
    "y": {"field": "b", "type": "quantitative"}
  }
}`)
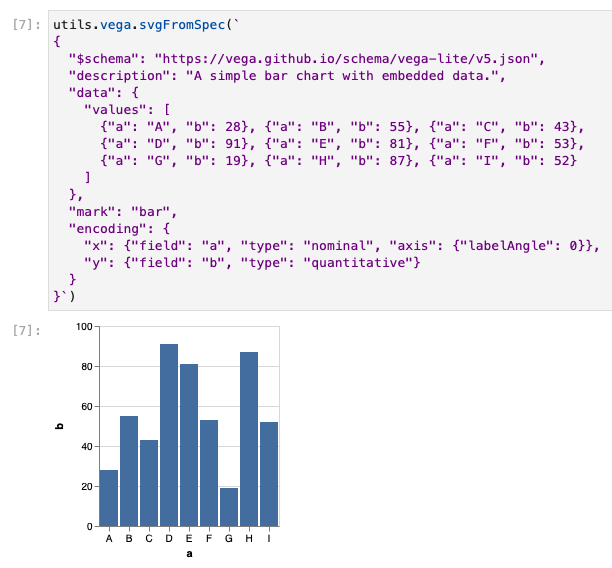
Parameters:
| Name | Type | Description |
|---|---|---|
vegaSpec |
String | Vega string specification |
display |
Display | the iJavaScript display |
(static) svgFromVegaSpec(spec)
Renders a Vega (not Vega-lite) chart from a JSON / Object specification.
Unlike vega.embedFromVegaSpec() - this renders directly within Jupyter.
Similar to vega.svgFromSpec(), the specification can either be an object or JSON encoded string.
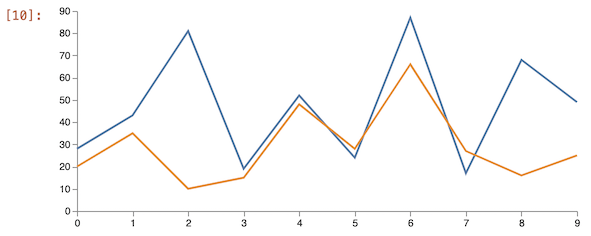
This example is from the Vega Line Chart example
utils.vega.svgFromSpec({
  "$schema": "https://vega.github.io/schema/vega/v5.json",
  "description": "A basic line chart example.",
  "width": 500,
  "height": 200,
  "padding": 5,

  "signals": [
    {
      "name": "interpolate",
      "value": "linear",
      "bind": {
        "input": "select",
        "options": [
          "basis",
          "cardinal",
          "catmull-rom",
          "linear",
          "monotone",
          "natural",
          "step",
          "step-after",
          "step-before"
        ]
      }
    }
  ],

  "data": [
    {
      "name": "table",
      "values": [
        {"x": 0, "y": 28, "c":0}, {"x": 0, "y": 20, "c":1},
        {"x": 1, "y": 43, "c":0}, {"x": 1, "y": 35, "c":1},
        {"x": 2, "y": 81, "c":0}, {"x": 2, "y": 10, "c":1},
        {"x": 3, "y": 19, "c":0}, {"x": 3, "y": 15, "c":1},
        {"x": 4, "y": 52, "c":0}, {"x": 4, "y": 48, "c":1},
        {"x": 5, "y": 24, "c":0}, {"x": 5, "y": 28, "c":1},
        {"x": 6, "y": 87, "c":0}, {"x": 6, "y": 66, "c":1},
        {"x": 7, "y": 17, "c":0}, {"x": 7, "y": 27, "c":1},
        {"x": 8, "y": 68, "c":0}, {"x": 8, "y": 16, "c":1},
        {"x": 9, "y": 49, "c":0}, {"x": 9, "y": 25, "c":1}
      ]
    }
  ],

  "scales": [
    {
      "name": "x",
      "type": "point",
      "range": "width",
      "domain": {"data": "table", "field": "x"}
    },
    {
      "name": "y",
      "type": "linear",
      "range": "height",
      "nice": true,
      "zero": true,
      "domain": {"data": "table", "field": "y"}
    },
    {
      "name": "color",
      "type": "ordinal",
      "range": "category",
      "domain": {"data": "table", "field": "c"}
    }
  ],

  "axes": [
    {"orient": "bottom", "scale": "x"},
    {"orient": "left", "scale": "y"}
  ],

  "marks": [
    {
      "type": "group",
      "from": {
        "facet": {
          "name": "series",
          "data": "table",
          "groupby": "c"
        }
      },
      "marks": [
        {
          "type": "line",
          "from": {"data": "series"},
          "encode": {
            "enter": {
              "x": {"scale": "x", "field": "x"},
              "y": {"scale": "y", "field": "y"},
              "stroke": {"scale": "color", "field": "c"},
              "strokeWidth": {"value": 2}
            },
            "update": {
              "interpolate": {"signal": "interpolate"},
              "strokeOpacity": {"value": 1}
            },
            "hover": {
              "strokeOpacity": {"value": 0.5}
            }
          }
        }
      ]
    }
  ]
});
Parameters:
| Name | Type | Description |
|---|---|---|
spec |
String | Object | Vega specification |
(static) vegaLiteMimeType(vegaLiteSpec)
Sends a vega-lite specification using the vega-lite mime-type.
Note, the vega.svgFromSpec() and vega.embedFromSpec() are recommended, as there are a few situations this has seemed to fail.
See the supported Jupyter Lab mime-types for additional detail
Example
// vega-lite spec examples found here: https://vega.github.io/vega-lite/examples/
utils.vega.vegaLiteMimeType({
  "$schema": "https://vega.github.io/schema/vega-lite/v5.json",
  "description": "A simple bar chart with embedded data.",
  "data": {
    "values": [
      {"a": "A", "b": 28}, {"a": "B", "b": 55}, {"a": "C", "b": 43},
      {"a": "D", "b": 91}, {"a": "E", "b": 81}, {"a": "F", "b": 53},
      {"a": "G", "b": 19}, {"a": "H", "b": 87}, {"a": "I", "b": 52}
    ]
  },
  "mark": "bar",
  "encoding": {
    "x": {"field": "a", "type": "nominal", "axis": {"labelAngle": 0}},
    "y": {"field": "b", "type": "quantitative"}
  }
});
Parameters:
| Name | Type | Description |
|---|---|---|
vegaLiteSpec |
Object | String | vega-lite specification |
(static) vegaMimeType(vegaSpec)
Send a vega specification using the vega mime-type.
Note, the vega.svgFromVegaSpec() and vega.embedFromVegaSpec() are recommended, as there are some situations this has seemed to fail.
See the supported Jupyter Lab mime-types for additional detail
Example
// vega specification examples found here: https://vega.github.io/vega/examples/
utils.vega.vegaMimeType({
  "$schema": "https://vega.github.io/schema/vega/v5.json",
  "description": "An example of a space-fulling radial layout for hierarchical data.",
  "width": 600,
  "height": 600,
  "padding": 5,
  "autosize": "none",

  "data": [
    {
      "name": "tree",
      "url": "https://vega.github.io/vega/data/flare.json",
      "transform": [
        {
          "type": "stratify",
          "key": "id",
          "parentKey": "parent"
        },
        {
          "type": "partition",
          "field": "size",
          "sort": {"field": "value"},
          "size": [{"signal": "2 * PI"}, {"signal": "width / 2"}],
          "as": ["a0", "r0", "a1", "r1", "depth", "children"]
        }
      ]
    }
  ],
  ...
});
Parameters:
| Name | Type | Description |
|---|---|---|
vegaSpec |
Object | String | vega specification |
