This walkthrough is also available as a Jupyter ipynb Notebook - you can run yourself
Vega-Lite is a charting library that provides a great deal of flexibility while also allowing for very simple use cases.
The Vega-Lite JavaScript API provides a convenient way to write Vega-Lite specifications in a programmatic fashion.
- (see @vega/vega-lite-api-v5 on observablehq for a great introduction)
- (see vega-lite documentation for deeper options)
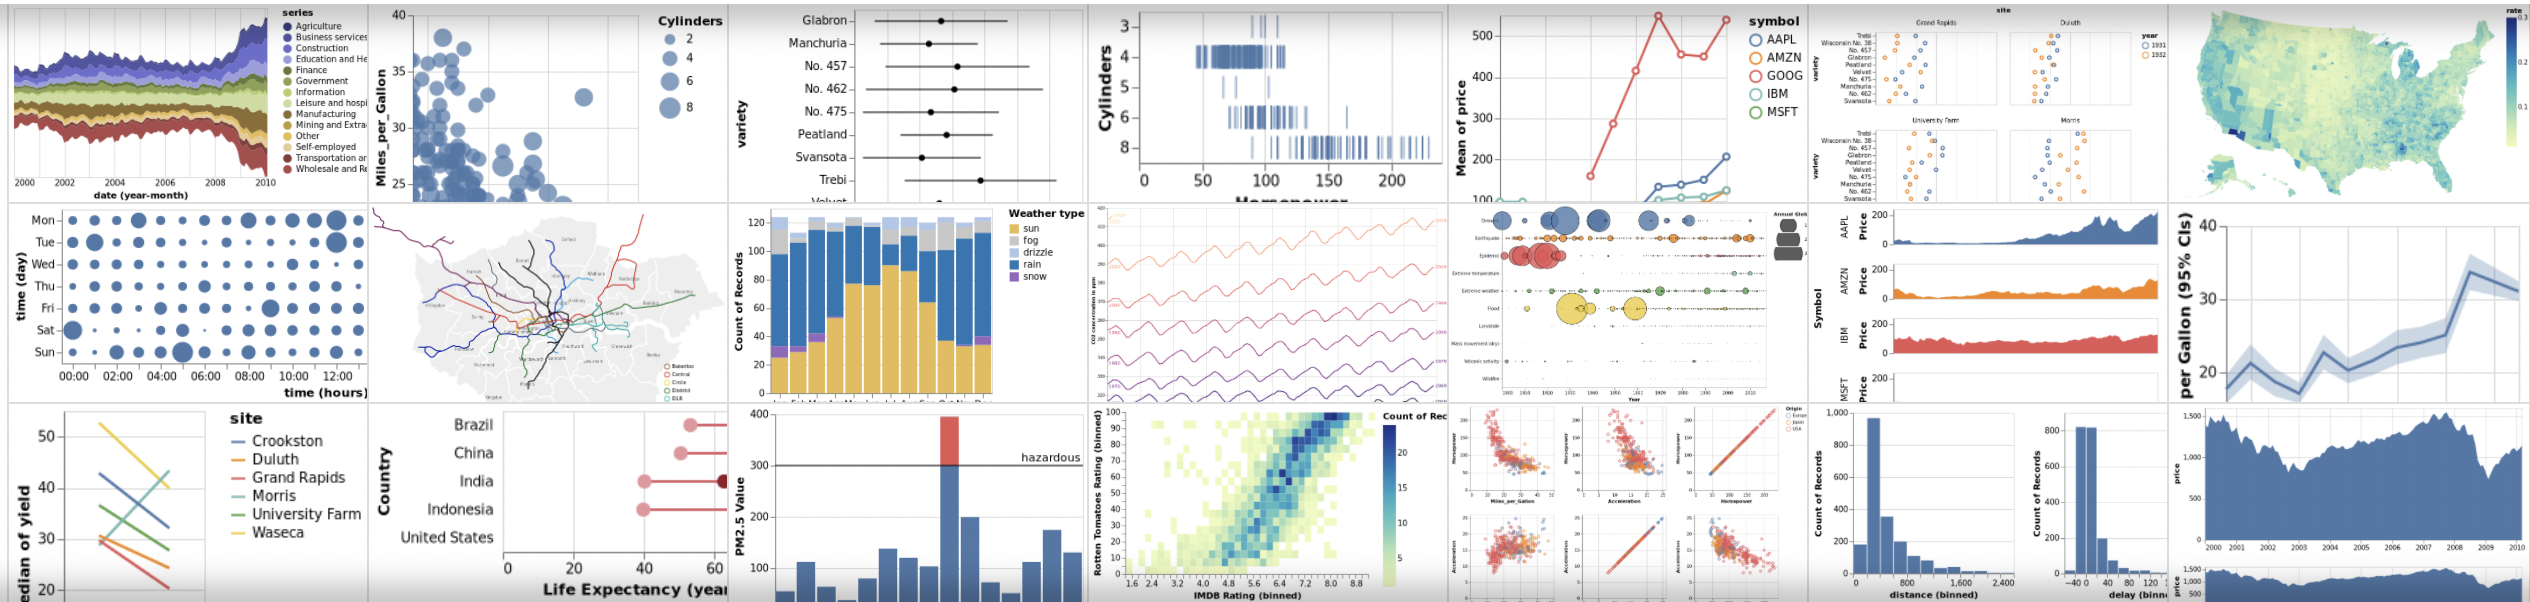
Under the hood, it creates complete Vega Charting specifications that further uses d3 as a visualization kernel
In our case two options are supported:
- through the vega-lite JSON specification - a high level grammar that creates
- through the vega-lite-api - a JavaScript api to write the vega-lite specifications
(As quick summary: Vega-Lite-Api: creates -> Vega-Lite JSON specifications: creates -> Vega charting specifications: -> using D3 as a visualization kernel)
For more:
- See the excellent Vega-Lite-API Observable Notebooks and Jeffrey Heer's Curriculum
- or see the Vega-Lite Examples and Vega Examples
- additionally see the y-combinator article with a developer here
Libraries Used
First we will need an instance of the jupyter-ijavascript-utils library.
utils = require('jupyter-ijavascript-utils');
['utils'];
Getting Data
We'll be working with three datasets:
Explicit Data:
//-- explicit data
simpleData = [{fruit:'Apples',yield:20,year:'2020'},{fruit:'Apples',yield:22,year:'2021'},
              {fruit:'Bananas',yield:15,year:'2020'},{fruit:'Bananas',yield:12,year:'2021'},
              {fruit:'Pears',yield:18,year:'2020'},{fruit:'Pears',yield:19,year:'2021'}];
$$.json(simpleData);
//-- JupyterLab shows the data in a collapsible viewer
Datasets module / Vega-Datasets
Data loaded from the datasets / vega-datasets module
//-- note that as this is using the ijs.await function,
//-- cells afterward can be synchronous and still assume the data is loaded

utils.ijs.await(async ($$, console) => {
  cars = await utils.datasets.fetch('cars.json');
  console.log(`loaded cars:${cars.length}`);
});
//-- loaded cars:406
URL within the Spec
We can also request that vega make the request for the data, if it is within the specification.
// utils.vega.svg((vl) => vl.markCircle()
//     .data({ url: 'https://vega.github.io/vega-lite/examples/data/movies.json' })
//     ...
// });
Getting Started
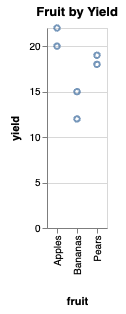
The simplext example is to render a small dataset:
simpleData = [{fruit:'Apples',yield:20,year:'2020'},{fruit:'Apples',yield:22,year:'2021'},
              {fruit:'Bananas',yield:15,year:'2020'},{fruit:'Bananas',yield:12,year:'2021'},
              {fruit:'Pears',yield:18,year:'2020'},{fruit:'Pears',yield:19,year:'2021'}];
We would like to render this into a chart, say with points first:
utils.vega.svg(
    // accept the reference to the vega-lite instance
    (vl) =>
    // render as points
    vl.markPoint()
        // use simpleData as the data source
        .data(simpleData)
        // title
        .title('Fruit by Yield')
        // this is where the x, and y are encoded
        .encode(
            // use the 'yield' property as the y axis
            // note this is fieldQ - a qualitative number with a numeric value
            vl.y().fieldQ('yield'),
            // use the 'fruit' property as the x axis
            // note this is fieldN - a nominative string with no numeric value
            vl.x().fieldN('fruit')
        )
)
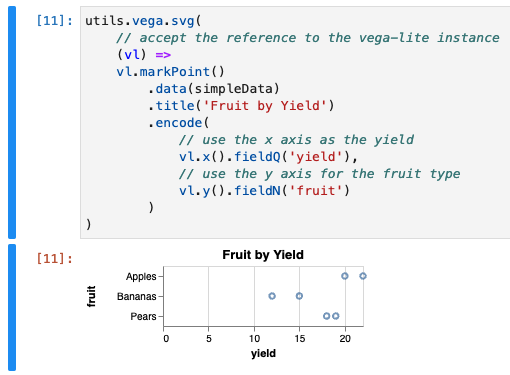
Flip the X and Y axis
Note that the order that we put the axes don't matter.
Let's swap the fields used by the x and y axes:
utils.vega.svg(
    // accept the reference to the vega-lite instance
    (vl) =>
    vl.markPoint()
        .data(simpleData)
        .title('Fruit by Yield')
        .encode(
            // use the x axis as the yield
            vl.x().fieldQ('yield'),
            // use the y axis for the fruit type
            vl.y().fieldN('fruit')
        )
)
Make a Line Chart
We can change the type of mark to markLine to make it a line chart
utils.vega.svg(
// accept the reference to the vega-lite instance
(vl) =>
vl.markPoint()
.data(simpleData)
.title('Fruit by Yield')
.encode(
vl.x().fieldQ('yield'),
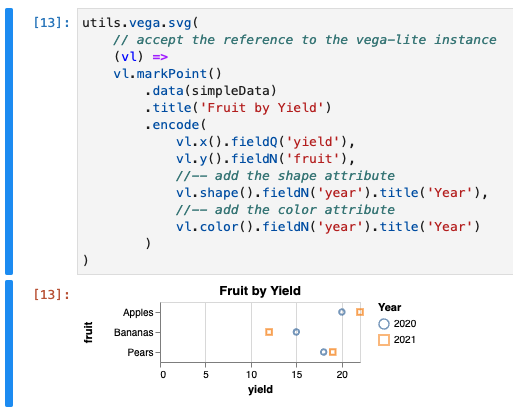
vl.y().fieldN('fruit'),
//-- add the shape attribute
vl.shape().fieldN('year').title('Year'),
//-- add the color attribute
vl.color().fieldN('year').title('Year')
)
)
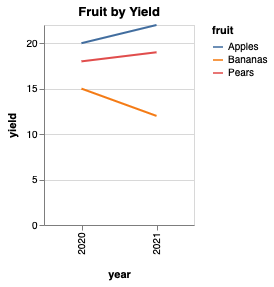
Make a Line Chart
We can change the type of mark to markLine to make it a line chart
utils.vega.svg(
    (vl) =>
    // change from `markPoint` to `markLine`
    vl.markLine()
        .data(simpleData)
        .title('Fruit by Yield')
        // set the width of the graph
        .width(150)
        .encode(
            vl.y().fieldQ('yield'),
            // change the field to 'year' from 'fruit'
            vl.x().fieldN('year'),
            // add a new series coloration, using 'fruit'
            vl.color().fieldN('fruit')
        )
)
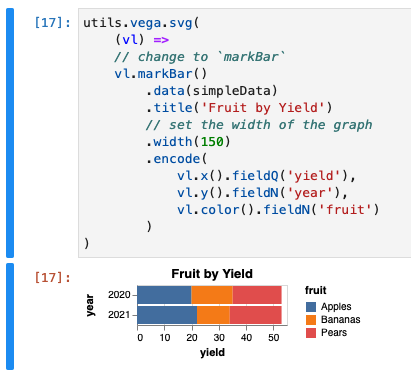
Make a Bar Chart
We can change the type of mark to markBar to make it a bar chart
utils.vega.svg(
    (vl) =>
    // change to `markBar`
    vl.markBar()
        .data(simpleData)
        .title('Fruit by Yield')
        // set the width of the graph
        .width(150)
        .encode(
            vl.x().fieldQ('yield'),
            vl.y().fieldN('year'),
            vl.color().fieldN('fruit')
        )
)
Datasets module / Vega-Datasets
We can also load data from the the datasets / vega-datasets module
//-- note that as this is using the ijs.await function,
//-- cells afterward can be synchronous and still assume the data is loaded

utils.ijs.await(async ($$, console) => {
  cars = await utils.datasets.fetch('cars.json');
  console.log(`loaded cars:${cars.length}`);
});
//-- loaded cars:406
Note that even though the following line is synchronous, is still waits for the line above to complete before rendering.
(It does this because we are using the ijs.await function - otherwise it wouldn't wait)
console.log(`how many cars types do we have? ${utils.aggregate.distinct(cars, 'Name')}`);
// how many cars types do we have? 311
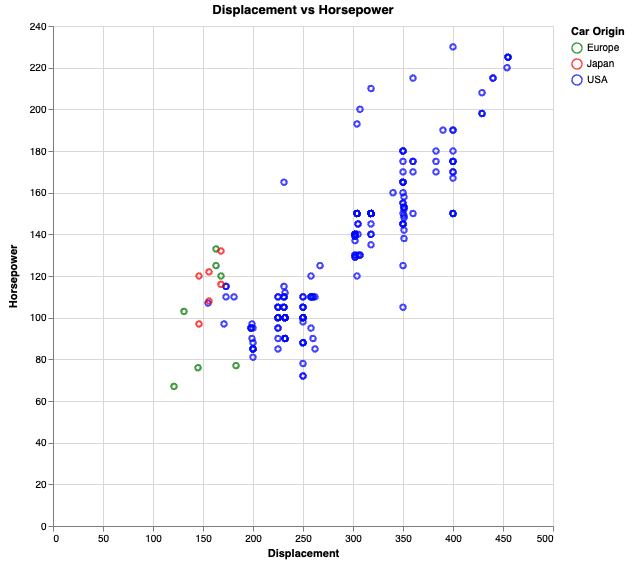
Types of Fields and Scales
Types of fields:
- fieldT (type: 'temporal') - time based
- fieldN (type: 'nominal') - Represents a discrete category (string)
- fieldQ (type: 'qualitative') - Represents a number
See the Vega-Lite Axis Documentation
utils.vega.svg((vl) => vl.markPoint()
  .data(cars)
  .title('Displacement vs Horsepower')
  .width(500)
  .height(500)
  .transform(
    vl.filter('datum.Cylinders > 4')
  )
  .encode(
    //-- Qualitiative field - a number
    //-- that can have the position determined relative to another and charted
    vl.x().fieldQ('Displacement'),
    vl.y().fieldQ('Horsepower'),
    vl.color().fieldN('Origin').title('Car Origin').scale({ range: ['green', 'red', 'blue'] })
  )
)
Objects / Specification
Vega-Lite is simply a JavaScript API for creating the JavaScript Object specifications.
You can also include those specifications within the definition, like this:
//-- notice how this and the specification above mirror each other.
utils.vega.svg((vl) => vl.markPoint()
    .data(cars)
    .title('Displacement vs Horsepower')
    .width(500)
    .height(500)
    .transform(
      vl.filter('datum.Cylinders > 4')
    )
    .encode(
      vl.x({field:'Displacement', type:'quantitative'}),
      vl.y({field:'Horsepower', type:'quantitative'}),
      vl.color({
       field:'Origin', title:'Car Origin', type:'nominal',
       scale: {range: ['green', 'red', 'blue']
      }}
     )
    )
  )
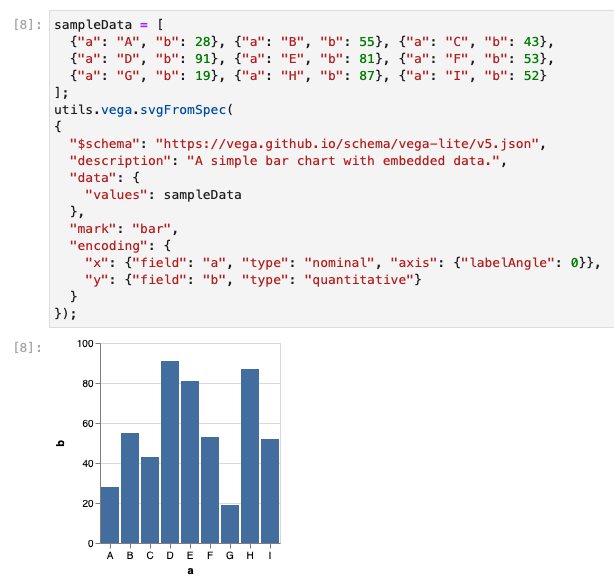
Rendering Via Specifications
Rendering via the specifications can be easier for some people to understand than through the Vega-Lite-Api
It also means, you can pass directly from the vega lite examples - such as this one using the bar charts example
sampleData = [
  {"a": "A", "b": 28}, {"a": "B", "b": 55}, {"a": "C", "b": 43},
  {"a": "D", "b": 91}, {"a": "E", "b": 81}, {"a": "F", "b": 53},
  {"a": "G", "b": 19}, {"a": "H", "b": 87}, {"a": "I", "b": 52}
];
utils.vega.svgFromSpec(
{
  "$schema": "https://vega.github.io/schema/vega-lite/v5.json",
  "description": "A simple bar chart with embedded data.",
  "data": {
    //-- data listed explicitly in the spec is also supported
    "values": sampleData
  },
  "mark": "bar",
  "encoding": {
    "x": {"field": "a", "type": "nominal", "axis": {"labelAngle": 0}},
    "y": {"field": "b", "type": "quantitative"}
  }
});
Loading directly via URL
To load data by URL, simply set the data attribute like so:
.data({ url: 'https://vega.github.io/vega-lite/examples/data/movies.json' })
For example:
utils.vega.svg((vl) =>
  vl.markPoint()
    .title('Binned Rotten Tomatoes Rating by IMDB Rating')
    .data({ url: 'https://vega.github.io/vega-lite/examples/data/movies.json' })
    .encode(
      //-- limit to 20 bins
      vl.x().fieldQ('Rotten Tomatoes Rating'),
      vl.y().fieldQ('IMDB Rating')
    ));
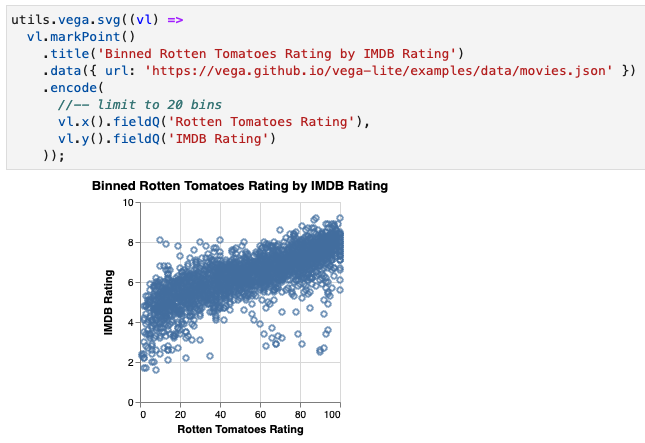
Unfortunately though, the data is really hard to read at this size.
Bins
Bins are especially helpful in numeric columns, as they can then group values based on various bin sizes.
Say for example, if we instead limited it to only 20 categories each. Would that be easier to read?
Binning becomes rather simple as we
(notice we access the movies directly - without loading)
utils.vega.svg((vl) =>
  vl.markCircle()
    .title('Binned Rotten Tomatoes Rating by IMDB Rating')
    .data({ url: 'https://vega.github.io/vega-lite/examples/data/movies.json' })
    .encode(
      //-- limit to 20 bins
      vl.x().fieldQ('Rotten Tomatoes Rating').bin({maxbins: 20}),
      vl.y().fieldQ('IMDB Rating').bin({maxbins: 20}),
      //-- set the size based on the number of records in the 'bin'
      vl.size().count()
    ));
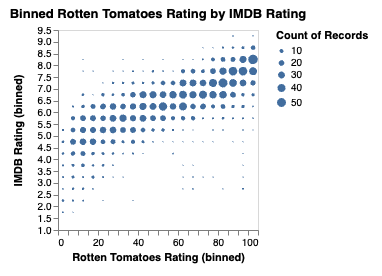
Much better.
Appendix
Note on Accessing Data
Some examples, may directly reference the data
(Note that sometimes they may use a URL that you may want to download or access directly)
In our case, the Scatterplot Pan & Zoom example
the data is originally as follows:
{
  "$schema": "https://vega.github.io/schema/vega-lite/v5.json",
  "data": {"url": "data/cars.json"},
  ...
We need to change it to the full path:
utils.vega.svgFromSpec({
  "$schema": "https://vega.github.io/schema/vega-lite/v5.json",
  "data": {"url": "https://vega.github.io/vega-lite/data/cars.json"},
  "params": [{
    "name": "grid",
    "select": "interval",
    "bind": "scales"
  }],
  "mark": "circle",
  "encoding": {
    "x": {
      "field": "Horsepower", "type": "quantitative",
      "scale": {"domain": [75, 150]}
    },
    "y": {
      "field": "Miles_per_Gallon", "type": "quantitative",
      "scale": {"domain": [20, 40]}
    },
    "size": {"field": "Cylinders", "type": "quantitative"}
  }
});
Note that the data binding can also work within vega-lite-api:
utils.vega.embed((vl) => vl.markCircle()
  .data({"url": "https://vega.github.io/vega-lite/data/cars.json"})
  .params({
    "name": "grid",
    "select": "interval",
    "bind": "scales"
  })
  .encode(
    vl.x().fieldQ('Horsepower').scale({"domain": [75, 150]}),
    vl.y().fieldQ('Miles_per_Gallon').scale({"domain": [20, 40]}),
    vl.size().fieldQ('Cylinders')
  )
)
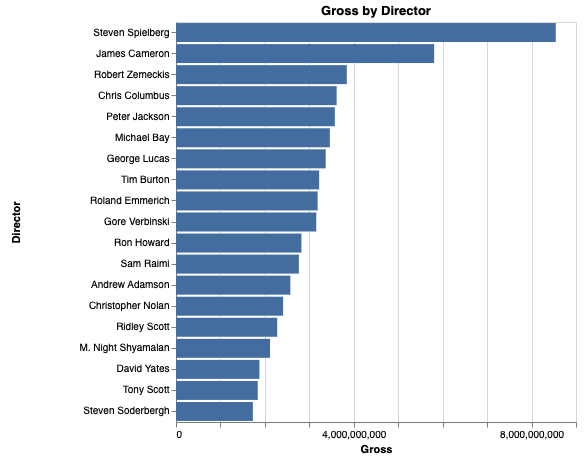
Transformations
There are many different types of transforms, and aggregations you can also do within vega.
Personally, I tend to prefer doing the aggregation beforehand, and passing the results to the data attribute,
but there are a number of rather interesting points why you may want to do it within Vega.
See the y-combinator article with a developer here
(Notice the commas separating out statements)
utils.vega.svg((vl) =>
  vl.markBar()
    .title('Gross by Director')
    .width(400).height(400)
    .data({ url: 'https://vega.github.io/vega-lite/examples/data/movies.json' })
    .transform(
      //-- filter records in dataset (datum) where .Director is found
      vl.filter('datum.Director != null'),

      //-- group by the Director field, and aggregate into the Gross field
      vl.aggregate(
          vl.sum('Worldwide Gross').as('Gross')
      ).groupby('Director'),

      //-- sort by 'Gross' and generate Rank field
      vl.window(vl.rank().as('Rank'))
        .sort(vl.field('Gross').order('descending')),

      //-- limit to only the top 20
      vl.filter('datum.Rank < 20')
    )
    .encode(
      vl.x().fieldQ('Gross'),
      vl.y().fieldN('Director')
        .sort(vl.field('Gross').order('descending'))
    ));
Maps / Choropleths
Choropleths are data driven maps.

See the Let's make a Data Driven Map to make your own.
Jupyter Lab support for Vega-Lite
For this tutorial, we'll be working with the vega module.
Note that Jupyter Lab has support for the vega mimetype, and can be used through the vega.vegaMimeType() and vega.vegaLiteMimeType() entries.
However, it seemed at the time of this witing that it did not work in all cases:
vegaSpec = {
//-- spec from the example
"$schema": "https://vega.github.io/schema/vega-lite/v5.json",
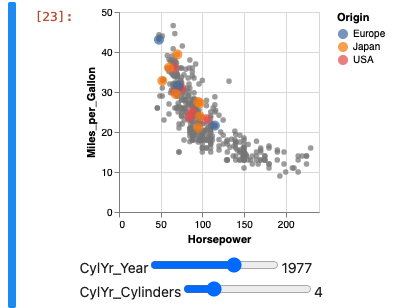
"description": "Drag the sliders to highlight points.",
"data": {"url": "https://vega.github.io/vega-lite/examples/data/cars.json"},
"transform": [{"calculate": "year(datum.Year)", "as": "Year"}],
"layer": [{
"params": [{
"name": "CylYr",
"value": [{"Cylinders": 4, "Year": 1977}],
"select": {"type": "point", "fields": ["Cylinders", "Year"]},
"bind": {
"Cylinders": {"input": "range", "min": 3, "max": 8, "step": 1},
"Year": {"input": "range", "min": 1969, "max": 1981, "step": 1}
}
}],
"mark": "circle",
"encoding": {
"x": {"field": "Horsepower", "type": "quantitative"},
"y": {"field": "Miles_per_Gallon", "type": "quantitative"},
"color": {
"condition": {"param": "CylYr", "field": "Origin", "type": "nominal"},
"value": "grey"
}
}
}, {
"transform": [{"filter": {"param": "CylYr"}}],
"mark": "circle",
"encoding": {
"x": {"field": "Horsepower", "type": "quantitative"},
"y": {"field": "Miles_per_Gallon", "type": "quantitative"},
"color": {"field": "Origin", "type": "nominal"},
"size": {"value": 100}
}
}]
};
This will work correctly:
// this will work because we are using
utils.vega.embedFromSpec(vegaSpec);
However the following will not in all cases, as an older version of Vega Lite is embedded within Jupyter. (At least as of May 2022)
//-- use the mimetype supported by vega will fail
display.mime({ 'application/vnd.vega.v5+json': vegaSpec });
// Javascript Error: Cannot read properties of undefined (reading 'length')
This is the same as calling the vega.vegaMimeType function:
utils.vega.vegaMimeType(vegaSpec);
// Javascript Error: Cannot read properties of undefined (reading 'length')
See the vega.vegaMimeType() and vega.vegaLiteMimeType() entries for more.
- See the excellent Vega-Lite-API Observable Notebooks and Jeffrey Heer's Curriculum
- or see the Vega-Lite Examples and Vega Examples