This walkthrough is also available as a Jupyter ipynb Notebook - you can run yourself
Generating Tables
[todo]
Use tables to:
- filter
- sort
- highlight rows / columns / style entire table
- add columns
- format data
- export to different types of formats:
- html
- markdown
- csv
- array
utils = require('jupyter-ijavascript-utils');
['utils'];
[ 'utils' ]
Accessing a Sample Dataset
The Vega team has a Sample Datasets library
The jupyter-ijavascript-utils library references it, so you can get sample data quickly.
We can see the list of the datasets available: utils.datasets.list()
// [ // 'annual-precip.json', // 'anscombe.json', // 'barley.json', // 'budget.json', // 'budgets.json', // 'burtin.json', // ... // ] The DataSet we want is the facinating GapMinder Life Expectancy study
$$.async()
utils.datasets.fetch('gapminder.json')
.then(data => {
	gapMinder = data;
	$$.sendResult(`captured gap minder records: ${gapMinder.length}`);
});

// 'captured gap minder records: 693'
'captured gap minder records: 693'
As we called $$.async() - the cell knows that it should pause execution for the next cell until $$.sendResult(...) is called.
Note - the utils.ijs.await method available in the library can simplify this call, to support await.
//-- does the same thing as the cell above
utils.ijs.await(async ($$, console) => {
	gapMinder = await utils.datasets.fetch('gapminder.json');
    return `captured gap minder records: ${gapMinder.length}`;
});

// 'captured gap minder records: 693'
See the ijs.await() docs for more.
Understanding the Data
One option to understand the kinds of data is to always look at the first record:
gapMinder[0];

// gives:
// {
//   year: 1955,
//   country: 'Afghanistan',
//   cluster: 0,
//   pop: 8891209,
//   life_expect: 30.332,
//   fertility: 7.7
// }
{
  year: 1955,
  country: 'Afghanistan',
  cluster: 0,
  pop: 8891209,
  life_expect: 30.332,
  fertility: 7.7
}
Render as a Table
We can simply render this dataset through the command:
utils.table(objectCollection).render()
The TableGenerator#render will generate the HTML and then send it to the browser to render it.
utils.table(gapMinder)
    .limit(3)
    .render()
| year | country | cluster | pop | life_expect | fertility |
|---|---|---|---|---|---|
| 1,955 | Afghanistan | 0 | 8,891,209 | 30.332 | 7.7 |
| 1,960 | Afghanistan | 0 | 9,829,450 | 31.997 | 7.7 |
| 1,965 | Afghanistan | 0 | 10,997,885 | 34.02 | 7.7 |
Filtering Data
You can filter results similar to the Array.filter() method
utils.table(gapMinder)
    .filter((r) => r.country === 'Afghanistan')
    .render()
| year | country | cluster | pop | life_expect | fertility |
|---|---|---|---|---|---|
| 1,955 | Afghanistan | 0 | 8,891,209 | 30.332 | 7.7 |
| 1,960 | Afghanistan | 0 | 9,829,450 | 31.997 | 7.7 |
| 1,965 | Afghanistan | 0 | 10,997,885 | 34.02 | 7.7 |
| 1,970 | Afghanistan | 0 | 12,430,623 | 36.088 | 7.7 |
| 1,975 | Afghanistan | 0 | 14,132,019 | 38.438 | 7.7 |
| 1,980 | Afghanistan | 0 | 15,112,149 | 39.854 | 7.8 |
| 1,985 | Afghanistan | 0 | 13,796,928 | 40.822 | 7.9 |
| 1,990 | Afghanistan | 0 | 14,669,339 | 41.674 | 8 |
| 1,995 | Afghanistan | 0 | 20,881,480 | 41.763 | 8 |
| 2,000 | Afghanistan | 0 | 23,898,198 | 42.129 | 7.479 |
| 2,005 | Afghanistan | 0 | 29,928,987 | 43.828 | 7.069 |
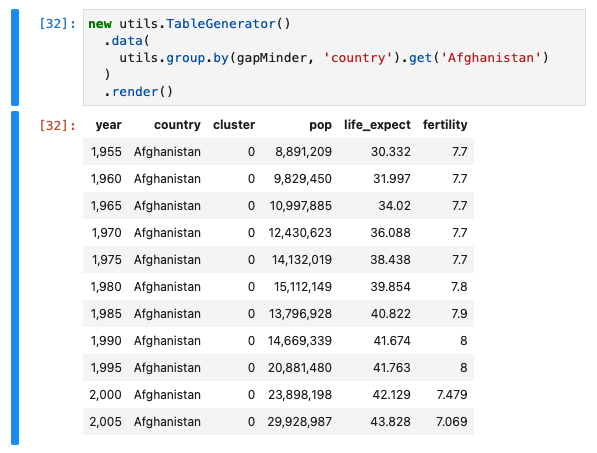
Rendering groups of data
This also works with groups to find a particular list.
I think I'm quite interested to see how the data looks for Afghanistan.
Lets use the utils.table() or TableGenerator() to make this easier to see.
utils.table(
    utils.group.by(gapMinder, 'country').get('Afghanistan')
)
  .render()
| year | country | cluster | pop | life_expect | fertility |
|---|---|---|---|---|---|
| 1,955 | Afghanistan | 0 | 8,891,209 | 30.332 | 7.7 |
| 1,960 | Afghanistan | 0 | 9,829,450 | 31.997 | 7.7 |
| 1,965 | Afghanistan | 0 | 10,997,885 | 34.02 | 7.7 |
| 1,970 | Afghanistan | 0 | 12,430,623 | 36.088 | 7.7 |
| 1,975 | Afghanistan | 0 | 14,132,019 | 38.438 | 7.7 |
| 1,980 | Afghanistan | 0 | 15,112,149 | 39.854 | 7.8 |
| 1,985 | Afghanistan | 0 | 13,796,928 | 40.822 | 7.9 |
| 1,990 | Afghanistan | 0 | 14,669,339 | 41.674 | 8 |
| 1,995 | Afghanistan | 0 | 20,881,480 | 41.763 | 8 |
| 2,000 | Afghanistan | 0 | 23,898,198 | 42.129 | 7.479 |
| 2,005 | Afghanistan | 0 | 29,928,987 | 43.828 | 7.069 |
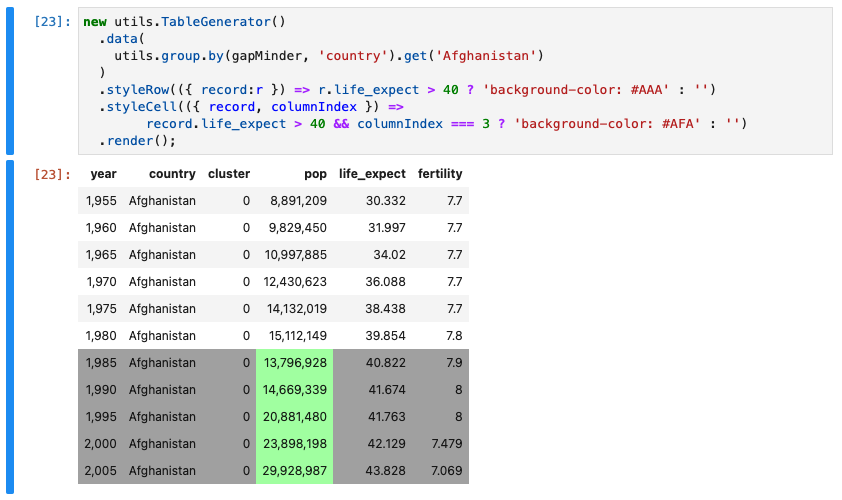
Styling a Table
Note that we can style the table if we'd like to show when the life expectancy rises above 40 years of age
utils.table(
    utils.group.by(gapMinder, 'country').get('Afghanistan')
  )
  .styleRow(({ record:r }) => r.life_expect > 40 ? 'background-color: #AAA' : '')
  .styleCell(({ record, columnIndex }) =>
        record.life_expect > 40 && columnIndex === 3 ? 'background-color: #AFA' : '')
  .render();
| year | country | cluster | pop | life_expect | fertility |
|---|---|---|---|---|---|
| 1,955 | Afghanistan | 0 | 8,891,209 | 30.332 | 7.7 |
| 1,960 | Afghanistan | 0 | 9,829,450 | 31.997 | 7.7 |
| 1,965 | Afghanistan | 0 | 10,997,885 | 34.02 | 7.7 |
| 1,970 | Afghanistan | 0 | 12,430,623 | 36.088 | 7.7 |
| 1,975 | Afghanistan | 0 | 14,132,019 | 38.438 | 7.7 |
| 1,980 | Afghanistan | 0 | 15,112,149 | 39.854 | 7.8 |
| 1,985 | Afghanistan | 0 | 13,796,928 | 40.822 | 7.9 |
| 1,990 | Afghanistan | 0 | 14,669,339 | 41.674 | 8 |
| 1,995 | Afghanistan | 0 | 20,881,480 | 41.763 | 8 |
| 2,000 | Afghanistan | 0 | 23,898,198 | 42.129 | 7.479 |
| 2,005 | Afghanistan | 0 | 29,928,987 | 43.828 | 7.069 |
Adjusting the Table
While the table is helpful, lets clean it up a bit:
- hide the cluster column
- add in a new column for the continent
- make the year render as a string - ex: 1966
We'll do this through
continents = [
  { id: 0, continent: 'South Asia' },
  { id: 1, continent: 'Europe & Central Asias' },
  { id: 2, continent: 'Sub-Saharan Africa' },
  { id: 3, continent: 'Americas' },
  { id: 4, continent: 'East Asia & Pacific' },
  { id: 5, continent: 'Middle East & North Africa' }
];
clusterMap = utils.group.index(continents, 'id');
// map of contents with the id field as the key
Map(6) {
  0 => { id: 0, continent: 'South Asia' },
  1 => { id: 1, continent: 'Europe & Central Asias' },
  2 => { id: 2, continent: 'Sub-Saharan Africa' },
  3 => { id: 3, continent: 'Americas' },
  4 => { id: 4, continent: 'East Asia & Pacific' },
  5 => { id: 5, continent: 'Middle East & North Africa' }
}
First, lets augment the data with the continent
Any properties passed in the object to augment, are appended to the dataset (non-mutating)
utils.table(gapMinder)
  .filter((r) => r.country === 'Afghanistan')

  //-- add new field / column
  .augment({
    continent: (r) => clusterMap.get(r.cluster).continent
  })

  .render();
| year | country | cluster | pop | life_expect | fertility | continent |
|---|---|---|---|---|---|---|
| 1,955 | Afghanistan | 0 | 8,891,209 | 30.332 | 7.7 | South Asia |
| 1,960 | Afghanistan | 0 | 9,829,450 | 31.997 | 7.7 | South Asia |
| 1,965 | Afghanistan | 0 | 10,997,885 | 34.02 | 7.7 | South Asia |
| 1,970 | Afghanistan | 0 | 12,430,623 | 36.088 | 7.7 | South Asia |
| 1,975 | Afghanistan | 0 | 14,132,019 | 38.438 | 7.7 | South Asia |
| 1,980 | Afghanistan | 0 | 15,112,149 | 39.854 | 7.8 | South Asia |
| 1,985 | Afghanistan | 0 | 13,796,928 | 40.822 | 7.9 | South Asia |
| 1,990 | Afghanistan | 0 | 14,669,339 | 41.674 | 8 | South Asia |
| 1,995 | Afghanistan | 0 | 20,881,480 | 41.763 | 8 | South Asia |
| 2,000 | Afghanistan | 0 | 23,898,198 | 42.129 | 7.479 | South Asia |
| 2,005 | Afghanistan | 0 | 29,928,987 | 43.828 | 7.069 | South Asia |
Column Labels
The columns are the names of the properties on the objects by default.
We can change that by calling labels()
Use an object to map the property name to a string of what the Column Header should be.
utils.table(gapMinder)
  .filter((r) => r.country === 'Afghanistan')

  .augment({
    continent: (r) => clusterMap.get(r.cluster).continent
  })

  //-- labels (property: label name)
  .labels({ pop: 'population', life_expect: 'life expectancy'})

  .render();
| year | country | cluster | population | life expectancy | fertility | continent |
|---|---|---|---|---|---|---|
| 1,955 | Afghanistan | 0 | 8,891,209 | 30.332 | 7.7 | South Asia |
| 1,960 | Afghanistan | 0 | 9,829,450 | 31.997 | 7.7 | South Asia |
| 1,965 | Afghanistan | 0 | 10,997,885 | 34.02 | 7.7 | South Asia |
| 1,970 | Afghanistan | 0 | 12,430,623 | 36.088 | 7.7 | South Asia |
| 1,975 | Afghanistan | 0 | 14,132,019 | 38.438 | 7.7 | South Asia |
| 1,980 | Afghanistan | 0 | 15,112,149 | 39.854 | 7.8 | South Asia |
| 1,985 | Afghanistan | 0 | 13,796,928 | 40.822 | 7.9 | South Asia |
| 1,990 | Afghanistan | 0 | 14,669,339 | 41.674 | 8 | South Asia |
| 1,995 | Afghanistan | 0 | 20,881,480 | 41.763 | 8 | South Asia |
| 2,000 | Afghanistan | 0 | 23,898,198 | 42.129 | 7.479 | South Asia |
| 2,005 | Afghanistan | 0 | 29,928,987 | 43.828 | 7.069 | South Asia |
Formatting Columns
If we want to change how certain columns are rendered (such as avoiding columns for years)
We can use the formatter() method
Similar to the Augment method, all the properties passed on the object are passed to a function to format before printing.
utils.table(gapMinder)
  .filter((r) => r.country === 'Afghanistan')

  .augment({
    continent: (r) => clusterMap.get(r.cluster).continent
  })

  //-- labels (property: label name)
  .labels({ pop: 'population', life_expect: 'life expectancy'})

  //-- format a specific value, say a year to a String
  .formatter({
    // property: formattingFunction
    life_expect: (val) => String(val),

    //-- alternatively, you can convert to 'Number', 'String' or 'Boolean'
    year: 'string'
  })

  .render();
| year | country | cluster | population | life expectancy | fertility | continent |
|---|---|---|---|---|---|---|
| 1955 | Afghanistan | 0 | 8,891,209 | 30.332 | 7.7 | South Asia |
| 1960 | Afghanistan | 0 | 9,829,450 | 31.997 | 7.7 | South Asia |
| 1965 | Afghanistan | 0 | 10,997,885 | 34.02 | 7.7 | South Asia |
| 1970 | Afghanistan | 0 | 12,430,623 | 36.088 | 7.7 | South Asia |
| 1975 | Afghanistan | 0 | 14,132,019 | 38.438 | 7.7 | South Asia |
| 1980 | Afghanistan | 0 | 15,112,149 | 39.854 | 7.8 | South Asia |
| 1985 | Afghanistan | 0 | 13,796,928 | 40.822 | 7.9 | South Asia |
| 1990 | Afghanistan | 0 | 14,669,339 | 41.674 | 8 | South Asia |
| 1995 | Afghanistan | 0 | 20,881,480 | 41.763 | 8 | South Asia |
| 2000 | Afghanistan | 0 | 23,898,198 | 42.129 | 7.479 | South Asia |
| 2005 | Afghanistan | 0 | 29,928,987 | 43.828 | 7.069 | South Asia |
Specifying Columns
There are a few options to specifying which columns to show, or not, and the order.
In this example, we can simply keep all the columns - but not show one column in particular:
utils.table(
    utils.group.by(gapMinder, 'country').get('Afghanistan')
  )


  //-- add new field / column
  .augment({
    continent: (r) => clusterMap.get(r.cluster).continent
  })

  //-- labels (property: label name)
  .labels({ pop: 'population', life_expect: 'life expectancy'})


  //-- explicitly exclude a specific column
  .columnsToExclude(['cluster'])

  //-- or you could explicitly set the columns and order
  // .columns(['year', 'continent', 'country', 'pop', 'life_expect', 'fertility'])

  .render();
| year | country | population | life expectancy | fertility | continent |
|---|---|---|---|---|---|
| 1,955 | Afghanistan | 8,891,209 | 30.332 | 7.7 | South Asia |
| 1,960 | Afghanistan | 9,829,450 | 31.997 | 7.7 | South Asia |
| 1,965 | Afghanistan | 10,997,885 | 34.02 | 7.7 | South Asia |
| 1,970 | Afghanistan | 12,430,623 | 36.088 | 7.7 | South Asia |
| 1,975 | Afghanistan | 14,132,019 | 38.438 | 7.7 | South Asia |
| 1,980 | Afghanistan | 15,112,149 | 39.854 | 7.8 | South Asia |
| 1,985 | Afghanistan | 13,796,928 | 40.822 | 7.9 | South Asia |
| 1,990 | Afghanistan | 14,669,339 | 41.674 | 8 | South Asia |
| 1,995 | Afghanistan | 20,881,480 | 41.763 | 8 | South Asia |
| 2,000 | Afghanistan | 23,898,198 | 42.129 | 7.479 | South Asia |
| 2,005 | Afghanistan | 29,928,987 | 43.828 | 7.069 | South Asia |
Alternatively, you can specify only the columns to show and the order will be preserved
JSON.stringify(utils.object.keys(gapMinder));
// "year","country","cluster","pop","life_expect","fertility","continent"
'["year","country","cluster","pop","life_expect","fertility"]'
utils.table(
    utils.group.by(gapMinder, 'country').get('Afghanistan')
  )


  //-- add new field / column
  .augment({
    continent: (r) => clusterMap.get(r.cluster).continent
  })

  //-- labels (property: label name)
  .labels({ pop: 'population', life_expect: 'life expectancy'})


  //-- explicitly exclude a specific column
  //.columnsToExclude(['cluster'])
  //-- or you could explicitly set the columns and order
  .columns(['year', 'continent', 'country', 'pop', 'life_expect', 'fertility'])

  .render();
| year | continent | country | population | life expectancy | fertility |
|---|---|---|---|---|---|
| 1,955 | South Asia | Afghanistan | 8,891,209 | 30.332 | 7.7 |
| 1,960 | South Asia | Afghanistan | 9,829,450 | 31.997 | 7.7 |
| 1,965 | South Asia | Afghanistan | 10,997,885 | 34.02 | 7.7 |
| 1,970 | South Asia | Afghanistan | 12,430,623 | 36.088 | 7.7 |
| 1,975 | South Asia | Afghanistan | 14,132,019 | 38.438 | 7.7 |
| 1,980 | South Asia | Afghanistan | 15,112,149 | 39.854 | 7.8 |
| 1,985 | South Asia | Afghanistan | 13,796,928 | 40.822 | 7.9 |
| 1,990 | South Asia | Afghanistan | 14,669,339 | 41.674 | 8 |
| 1,995 | South Asia | Afghanistan | 20,881,480 | 41.763 | 8 |
| 2,000 | South Asia | Afghanistan | 23,898,198 | 42.129 | 7.479 |
| 2,005 | South Asia | Afghanistan | 29,928,987 | 43.828 | 7.069 |
Exporting to different types of data
Note that there are a few other types of output, such as:
Like the Markdown table shown here:
| year | country | cluster | pop | life_expect | fertility |
|---|---|---|---|---|---|
| 1,955 | Afghanistan | 0 | 8,891,209 | 30.332 | 7.7 |
| 1,960 | Afghanistan | 0 | 9,829,450 | 31.997 | 7.7 |
| 1,965 | Afghanistan | 0 | 10,997,885 | 34.02 | 7.7 |
| 1,970 | Afghanistan | 0 | 12,430,623 | 36.088 | 7.7 |
| 1,975 | Afghanistan | 0 | 14,132,019 | 38.438 | 7.7 |
| 1,980 | Afghanistan | 0 | 15,112,149 | 39.854 | 7.8 |
| 1,985 | Afghanistan | 0 | 13,796,928 | 40.822 | 7.9 |
| 1,990 | Afghanistan | 0 | 14,669,339 | 41.674 | 8 |
| 1,995 | Afghanistan | 0 | 20,881,480 | 41.763 | 8 |
| 2,000 | Afghanistan | 0 | 23,898,198 | 42.129 | 7.479 |
| 2,005 | Afghanistan | 0 | 29,928,987 | 43.828 | 7.069 |
Markdown
To render as Markdown, simply finish with the renderMarkdown() method
Note that this has an accompanying method: generateMarkdown()
utils.table(
    utils.group.by(gapMinder, 'country').get('Afghanistan')
  )

  //-- add new field / column
  .augment({
    continent: (r) => clusterMap.get(r.cluster).continent
  })

  .limit(3)

  //-- labels (property: label name)
  .labels({ pop: 'population', life_expect: 'life expectancy'})

  //-- format a specific value, say a year to a String
  .formatter({
    // property: formattingFunction
    life_expect: (val) => String(val),

    //-- alternatively, you can convert to 'Number', 'String' or 'Boolean'
    year: 'string'
  })

  //-- explicitly exclude a specific column
  .columnsToExclude(['cluster'])

  //-- or you could explicitly set the columns and order
  // .columns(['year', 'continent', 'country', 'pop', 'life_expect', 'fertility'])

  .renderMarkdown();
year|country    |population|life expectancy|fertility|continent
--  |--         |--        |--             |--       |--
1955|Afghanistan|8,891,209 |30.332         |7.7      |South Asia
1960|Afghanistan|9,829,450 |31.997         |7.7      |South Asia
1965|Afghanistan|10,997,885|34.02          |7.7      |South Asia
| year | country | population | life expectancy | fertility | continent |
|---|---|---|---|---|---|
| 1955 | Afghanistan | 8,891,209 | 30.332 | 7.7 | South Asia |
| 1960 | Afghanistan | 9,829,450 | 31.997 | 7.7 | South Asia |
| 1965 | Afghanistan | 10,997,885 | 34.02 | 7.7 | South Asia |
Render as CSV
To render as Markdown, simply finish with the renderCSV() method
Note that this has an accompanying method: generateCSV()
utils.table(
    utils.group.by(gapMinder, 'country').get('Afghanistan')
  )

  //-- add new field / column
  .augment({
    continent: (r) => clusterMap.get(r.cluster).continent
  })

  .limit(3)

  //-- labels (property: label name)
  .labels({ pop: 'population', life_expect: 'life expectancy'})

  //-- format a specific value, say a year to a String
  .formatter({
    // property: formattingFunction
    life_expect: (val) => String(val),

    //-- alternatively, you can convert to 'Number', 'String' or 'Boolean'
    year: 'string'
  })

  //-- explicitly exclude a specific column
  .columnsToExclude(['cluster'])

  //-- or you could explicitly set the columns and order
  // .columns(['year', 'continent', 'country', 'pop', 'life_expect', 'fertility'])

  .renderCSV();
"year","country","population","life expectancy","fertility","continent"
"1955","Afghanistan","8,891,209","30.332","7.7","South Asia"
"1960","Afghanistan","9,829,450","31.997","7.7","South Asia"
"1965","Afghanistan","10,997,885","34.02","7.7","South Asia"
Generate Array
If you want the results, so you can do further operations, use the generateArray method.
(It is safe to ignore the legacy generateArray, as it will be removed in future versions)
utils.table(
    utils.group.by(gapMinder, 'country').get('Afghanistan')
  )

  //-- add new field / column
  .augment({
    continent: (r) => clusterMap.get(r.cluster).continent
  })

  .limit(3)

  //-- labels (property: label name)
  .labels({ pop: 'population', life_expect: 'life expectancy'})

  //-- format a specific value, say a year to a String
  .formatter({
    // property: formattingFunction
    life_expect: (val) => String(val),

    //-- alternatively, you can convert to 'Number', 'String' or 'Boolean'
    year: 'string'
  })

  //-- explicitly exclude a specific column
  .columnsToExclude(['cluster'])

  //-- or you could explicitly set the columns and order
  // .columns(['year', 'continent', 'country', 'pop', 'life_expect', 'fertility'])

  .generateArray2();
[
  [
    'year',
    'country',
    'population',
    'life expectancy',
    'fertility',
    'continent'
  ],
  [ '1955', 'Afghanistan', 8891209, '30.332', 7.7, 'South Asia' ],
  [ '1960', 'Afghanistan', 9829450, '31.997', 7.7, 'South Asia' ],
  [ '1965', 'Afghanistan', 10997885, '34.02', 7.7, 'South Asia' ]
]