Constructor
new TableGenerator(data)
Function to format a value for a cell
Example
data = [{temp: 37, type: 'C'}, {temp: 310, type: 'K'}, {temp: 98, type: 'F'}];

//-- simple example where the temp property is converted, and type property overwritten
new TableGenerator(data)
 .generateMarkdown()

//-- gives
temp | type
---- | ----
37   | C
310  | K
98   | F
Parameters:
| Name | Type | Description |
|---|---|---|
data |
Array.<Object> | collection of objects |
Methods
augment(obj) → {TableGenerator}
Augments data with additional fields
(Convenience function to add additional values without augmenting the data.)
Note that doing a .map() on the dataset prior may have better performance
but doing so may modify the dataset - where this would not.
Example
sourceData = [{id: 1, temp_F:98}, {id: 2, temp_F:99}, {id: 3, temp_F:100}];

utils.table(sourceData)
 .augment({
   temp_C: (row) => (row.temp_F - 32) * 0.5556,
   temp_K: (row) => (row.temp_F - 32) * 0.5556 + 1000
 })
 .generateMarkdown()

//-- provides:

id | temp_F | temp_C | temp_K
-- | ------ | ------ | ------
1  | 98     | 36.667 | 309.817
2  | 99     | 37.222 | 310.372
3  | 100    | 37.778 | 310.928
Parameters:
| Name | Type | Description | ||||||||||||
|---|---|---|---|---|---|---|---|---|---|---|---|---|---|---|
obj |
Object | Object with properties to add to the result data Properties
|
Returns:
- chainable instance
- Type
- TableGenerator
border(borderCSS)
Convenience function to set an a border on the Data Cells.
This only applies when rendering HTML or generating HTML
As this adds additional CSS, the styling applied:
- to the whole table
- or to the rows
- or to the column
- or to the data cells will be affected
For example:
sourceData = [{id: 1, temp_F:98}, {id: 2, temp_F:99}, {id: 3, temp_F:100}];

utils.table(sourceData)
   .border('1px solid #aaa')
   .render();
| id | temp_F |
|---|---|
| 1 | 98 |
| 2 | 99 |
| 3 | 100 |
Parameters:
| Name | Type | Description |
|---|---|---|
borderCSS |
String | Boolean | CSS String to additionally apply HTML TD elements |
columns(values) → {TableGenerator}
Applies an optional set of columns / properties to render
Example
dataSet = [{reg:'z', source: 'A', temp: 99},
   {reg: 'z', source: 'B', temp: 98},
   {reg: 'z', source:'A', temp: 100}
];

//-- only show the temp and source columns
new TableGenerator(dataSet)
 .columns('temp', 'source') // or .columns(['temp', 'source'])
 .generateMarkdown();

//-- provides

temp | source
---- | ------
99   | A
98   | B
100  | A
Parameters:
| Name | Type | Description |
|---|---|---|
values |
Array.<String> | Optional array of exclusive fields to render\n If not provided, then all fields are rendered.\n If provided, then only the fields listed will be rendered\n |
Returns:
- chainable instance
- Type
- TableGenerator
columnsToExclude(values) → {TableGenerator}
Applies an optional set of columns / properties not to render
Example
dataSet = [{reg:'z', source: 'A', temp: 99},
   {reg: 'z', source: 'B', temp: 98},
   {reg: 'z', source:'A', temp: 100}
];

//-- only show the temp and source columns
new TableGenerator(dataSet)
 .columnsToExclude('reg') // or .columnsToExclude(['reg'])
 .generateMarkdown();

//-- provides

temp | source
---- | ------
99   | A
98   | B
100  | A
Parameters:
| Name | Type | Description |
|---|---|---|
values |
Array.<String> | Optional array of columns not to render\n If not provided, then all fields are rendered.\n If provided, then these fields will not be rendered under any circumstance.\n |
Returns:
- chainable instance
- Type
- TableGenerator
data(collection) → {TableGenerator}
- See:
Assigns the data to be used in generating the table.
Example
dataSet = [{temp: 37, type: 'C'}, {temp: 310, type: 'K'}, {temp: 98, type: 'F'}];

//-- simple example where the temp property is converted, and type property overwritten
new TableGenerator()
 .data(dataSet)
 .generateMarkdown()

//-- gives
temp | type
---- | ----
37   | C
310  | K
98   | F
Parameters:
| Name | Type | Description |
|---|---|---|
collection |
Array |
Returns:
- chainable instance
- Type
- TableGenerator
filter(filterFn) → {TableGenerator}
Filter the dataset
(This is a alternative to calling .filter() on the source data)
For example:
data = [{temp: 98, type: 'F'}, {temp: 37, type: 'C'}, {temp: 309, type: 'K'}];

//-- simple example where the temp property is converted, and type property overwritten
new TableGenerator(data)
 .filter((row) => row.type === 'C')
 .generateMarkdown()

//-- gives
temp | type
---- | ----
37   | C
Parameters:
| Name | Type | Description | ||||||
|---|---|---|---|---|---|---|---|---|
filterFn |
function | A function that returns Properties
|
Returns:
- Type
- TableGenerator
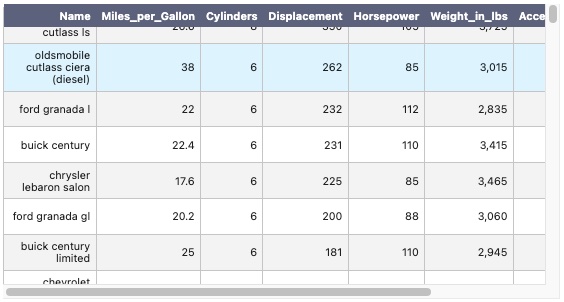
format(obj) → {TableGenerator}
Object that provides translations functions for matching properties.
(This is an alternate to formatterFn or simple .map() call on the source data)
NOTE: Only matching properties on the formatter object are changed - all others are left alone.
For example:
data = [
  {station: 'A', temp: 98, type: 'F', descr: '0123'},
  {station: 'A', temp: 99, type: 'F', descr: '0123456'},
  {station: 'A', temp: 100, type: 'F', descr: '0123456789'}
];

//-- simple example where the temp property is converted, and type property overwritten
new TableGenerator(data)
 .format({
   //-- property 'station' not mentioned, so no change

   //-- convert temperature to celsius
   temp: (value) => (value - 32) * 0.5556,
   //-- overwrite type from 'F' to 'C'
   type: 'C',
   //-- ellipsify to shorten the description string, if longer than 8 characters
   descr: (str) => utils.format.ellipsify(str, 8)
 }).renderMarkdown()
| station | temp | type | descr |
|---|---|---|---|
| A | 36.67 | F | 0123 |
| A | 37.225 | F | 0123456 |
| A | 37.781 | F | 01234567… |
Note, due to frequent requests, simple datatype conversions can be requested.
Only ('String', 'Number', and 'Boolean') are supported
data = [
  { propA: ' 8009', propB: 8009, isBoolean: 0},
  { propA: ' 92032', propB: 92032, isBoolean: 1},
  { propA: ' 234234', propB: 234234, isBoolean: 1},
];

utils.table(data)
  .format({
    //-- convert Prop A to Number - so render with Locale Number Formatting
    propA: 'number',
    //-- conver PropB to String - so render without Locale Number Formatting
    propB: 'string',
    //-- render 'True' or 'False'
    isBoolean: 'boolean'
  }).renderMarkdown();
| propA | propB | isBoolean |
|---|---|---|
| 8,009 | 8009 | false |
| 92,032 | 92032 | true |
| 234,234 | 234234 | true |
Parameters:
| Name | Type | Description | ||||||
|---|---|---|---|---|---|---|---|---|
obj |
Object | object with properties storing arrow functions Properties
|
Returns:
- Type
- TableGenerator
formatterFn(fn) → {TableGenerator}
- See:
-
- format(obj) to format per property of the objects
Function that can format a value for a given row, cell
(value, cellIndex, header, rowIndex, row, record) => string
Parameters:
| Name | Type | Description | ||||||||||||||||||
|---|---|---|---|---|---|---|---|---|---|---|---|---|---|---|---|---|---|---|---|---|
fn |
function | Translation function to apply to all cells. When it runs, you will recieve a single parameter representing the current cell and row. Return what the new value should be. Properties
|
Returns:
- Type
- TableGenerator
fromArray(collection) → {TableGenerator}
- See:
-
- {TableGenerator.data}
- {TableGenerator.fromList}
Assigns the data by importing a 2 dimensional array.
If headers are not provided, then the first row of the collection is assumed.
If there is no header provided (by default) - then the first row is assumed.
dataSet = [ [ 'temp', 'type' ], [ 37, 'C' ], [ 310, 'K' ], [ 98, 'F' ] ];

new TableGenerator()
 .fromArray(dataSet)
 .generateMarkdown();
| temp | type |
|---|---|
| 37 | C |
| 310 | K |
| 98 | F |
However, if there is a header provided, it assumes there is none in teh first row.
headers = [ 'temp', 'type' ];
dataSet = [[ 37, 'C' ], [ 310, 'K' ], [ 98, 'F' ] ];

new TableGenerator()
 .fromArray(dataSet)
 .generateMarkdown();
| temp | type |
|---|---|
| 37 | C |
| 310 | K |
| 98 | F |
Parameters:
| Name | Type | Description |
|---|---|---|
collection |
Array.<Array> |
Returns:
- Type
- TableGenerator
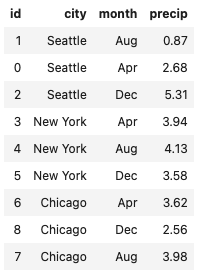
fromDataFrameObject(dataFrameObject) → {TableGenerator}
- See:
-
- https://danfo.jsdata.org/api-reference/dataframe/creating-a-dataframe#creating-a-dataframe-from-an-object
- {TableGenerator.fromList}
- {TableGenerator.fromObjectCollection}
- {TableGenerator.data}
Initializes the data in the tableGenerator with an object holding 1d tensor properties.
dfObject = {
  id: [
    1, 0, 2, 3, 4,
    5, 6, 8, 7
  ],
  city: [
    'Seattle',  'Seattle',
    'Seattle',  'New York',
    'New York', 'New York',
    'Chicago',  'Chicago',
    'Chicago'
  ],
  month: [
    'Aug', 'Apr',
    'Dec', 'Apr',
    'Aug', 'Dec',
    'Apr', 'Dec',
    'Aug'
  ],
  precip: [
    0.87, 2.68, 5.31,
    3.94, 4.13, 3.58,
    3.62, 2.56, 3.98
  ]
}

utils.table().fromDataFrameObject(dfObject).render()
| id | city | month | precip |
|---|---|---|---|
| 1 | Seattle | Aug | 0.87 |
| 0 | Seattle | Apr | 2.68 |
| 2 | Seattle | Dec | 5.31 |
| 3 | New York | Apr | 3.94 |
| 4 | New York | Aug | 4.13 |
| 5 | New York | Dec | 3.58 |
| 6 | Chicago | Apr | 3.62 |
| 8 | Chicago | Dec | 2.56 |
| 7 | Chicago | Aug | 3.98 |
Parameters:
| Name | Type | Description |
|---|---|---|
dataFrameObject |
Object | DataFrame with 1d tensor properties |
Returns:
- Type
- TableGenerator
fromList(array1d) → {TableGenerator}
- See:
-
- {TableGenerator.fromArray}
Assigns the data from a single 1 dimensional array.
Is syntatic sugar to simply wrap the 1 dimensional array into a 2 dimensional array.
let precip = [
  1, 0, 2, 3, 4
];

utils.table().fromList(precip).render()
_
1 0 2 3 4
Parameters:
| Name | Type | Description |
|---|---|---|
array1d |
Array |
Returns:
- Type
- TableGenerator
fromObjectCollection(collection) → {TableGenerator}
Assigns the data by importing in a collections of objects.
Note: this is the default functionality / syntatic sugar - as data is expected as a collection of objects.
Example
dataSet = [{temp: 37, type: 'C'}, {temp: 310, type: 'K'}, {temp: 98, type: 'F'}];

//-- simple example where the temp property is converted, and type property overwritten
new TableGenerator()
 .data(dataSet)
 .generateMarkdown()

//-- gives
temp | type
---- | ----
37   | C
310  | K
98   | F
Parameters:
| Name | Type | Description |
|---|---|---|
collection |
Array.<Object> |
Returns:
- Type
- TableGenerator
generateArray() → {TableArray}
- See:
Generates an a result set to allow for further processing
Example
dataSet = [{reg:'z', source: 'A', temp: 99},
   {reg: 'z', source: 'B', temp: 98},
   {reg: 'z', source:'A', temp: 100}
];

//-- only show the temp and source columns
new TableGenerator(dataSet)
 .columnsToExclude('reg') // or .columnsToExclude(['reg'])
 .generateArray();

//--

{
  headers: ['source', 'temp'],
  data: [
    ['A', 99],
    ['B', 98],
    ['A', 100],
  ]
}
Returns:
- Type
- TableArray
generateArray2() → {Array.<Array.<any>>}
- See:
Generates an array of objects in a 2d Array
NOTE: this can be helpful for needing to transpose results
Example
dataSet = [{reg:'z', source: 'A', temp: 99},
   {reg: 'z', source: 'B', temp: 98},
   {reg: 'z', source:'A', temp: 100}
];

//-- only show the temp and source columns
new TableGenerator(dataSet)
 .columnsToExclude('reg') // or .columnsToExclude(['reg'])
 .generateArray2();

//--
[
 ['source', 'temp'],
 ['A', 99],
 ['B', 98],
 ['A', 100],
];
Returns:
- 2d array with both headers and data included
- Type
- Array.<Array.<any>>
generateCSV()
Generates a CSV Table
generateDataFrameObject() → {Object}
Generates a Danfo compatible DataFrame Object.
(Where each property has a 1d collection of values)
dataSet = [{reg:'z', source: 'A', temp: 99},
  {reg: 'z', source: 'B', temp: 98},
  {reg: 'z', source:'A', temp: 100}
];

new TableGenerator(dataSet)
.generateDataFrameObject();

// {
//   reg: [ 'z', 'z', 'z' ],
//   source: [ 'A', 'A', 'B' ],
//   temp: [ 100, 99, 98 ]
// }
Returns:
- with each property as a column.
- Type
- Object
generateHTML() → {string}
Generates an html table
Returns:
- Type
- string
generateMarkdown() → {string}
Generates a markdown table
Returns:
- Type
- string
generateObjectCollection() → {Array.<Object>}
- See:
Generates a collection of objects as a result set.
Example:
dataSet = [{reg:'z', source: 'A', temp: 99},
   {reg: 'z', source: 'B', temp: 98},
   {reg: 'z', source:'A', temp: 100}
];

new TableGenerator(dataSet)
 .filter((obj) => ob.source === 'A')
 .sort('-temp')
 .limit(2)
 .generateObjectCollection();

// [
//   { reg: 'z', source: 'A', temp: 100 },
//   { reg: 'z', source: 'A', temp: 99 }
// ]
Returns:
- collection of objects
- Type
- Array.<Object>
generateTSV()
Generates a TSV Table
height(maxHeightCSS) → {TableGenerator}
Set the css max-height of the table when calling render. (Not used in generating html)
Defaults to '50vh' unless updated here.
Parameters:
| Name | Type | Description |
|---|---|---|
maxHeightCSS |
String | css to apply when rendering the table in html |
Returns:
- Type
- TableGenerator
labels(labelsObj) → {TableGenerator}
Sets the alternative labels to be used for specific fields.
single object with properties that should show a different label\n
Example
dataSet = [{source: 'A', temp: 99},
   {source: 'B', temp: 98},
   {source:'A', temp: 100}
];

//-- only show the temp and source columns
new TableGenerator(dataSet)
 .lables({ temp: 'temperature})
 .generateMarkdown();

//--

source | temperature
------ | -----------
A      | 99
B      | 98
C      | 100
Parameters:
| Name | Type | Description |
|---|---|---|
labelsObj |
Object |
Returns:
- chainable instance
- Type
- TableGenerator
limit(limitRecords) → {TableGenerator}
The number of rows to limit.
10 : means ascending 10 records.
-10 : means descending 10 records
Parameters:
| Name | Type | Description |
|---|---|---|
limitRecords |
Number | 0 for all records, + for ascending, - for descending |
Returns:
- chainable interface
- Type
- TableGenerator
offset(offsetRecords) → {TableGenerator}
The number of rows to skip before showing any records.
10 : means start showing results only after the first 10 records
-10 : means only show the last 10
Parameters:
| Name | Type | Description |
|---|---|---|
offsetRecords |
Number | the number of rows to skip |
Returns:
- chainable interface
- Type
- TableGenerator
printOptions(value, options) → {TableGenerator}
Options to give to printOptions
Example
dataSet = [
   {id: 1, dateTime:new Date(2022,3,2,9), child: { results: true }},
   {id: 1, dateTime:new Date(2022,3,3,9), child: { results: false }},
   {id: 1, dateTime:new Date(2022,3,4,9), child: { results: true }}
];

console.log(utils.table(dataSet)
    .generateMarkdown({align: true})
)

//--

id|dateTime            |child
--|--                  |--
1 |4/2/2022, 9:00:00 AM|{"results":true}
1 |4/3/2022, 9:00:00 AM|{"results":false}
1 |4/4/2022, 9:00:00 AM|{"results":true}

dataSet = [
   {id: 1, dateTime:new Date(2022,3,2,9), child: { results: true }},
   {id: 1, dateTime:new Date(2022,3,3,9), child: { results: false }},
   {id: 1, dateTime:new Date(2022,3,4,9), child: { results: true }}
];

console.log(utils.table(dataSet)
    .printOptions({ collapseObjects: true, dateFormat: 'toISOString'})
    .generateMarkdown({align: true})
)

id|dateTime            |child
--|--                  |--
1 |2022-04-02T14:00:00.000Z|[object Object]
1 |2022-04-03T14:00:00.000Z|[object Object]
1 |2022-04-04T14:00:00.000Z|[object Object]
Parameters:
| Name | Type | Description | |||||||||
|---|---|---|---|---|---|---|---|---|---|---|---|
value |
any | the value to print |
|||||||||
options |
Object | collection of options Properties
|
Returns:
- chainable instance
- Type
- TableGenerator
render()
Renders the html table in the cell results.
weather = [
  { id: 1, city: 'Seattle',  month: 'Aug', precip: 0.87 },
  { id: 0, city: 'Seattle',  month: 'Apr', precip: 2.68 },
  { id: 2, city: 'Seattle',  month: 'Dec', precip: 5.31 },
  { id: 3, city: 'New York', month: 'Apr', precip: 3.94 },
  { id: 4, city: 'New York', month: 'Aug', precip: 4.13 },
  { id: 5, city: 'New York', month: 'Dec', precip: 3.58 },
  { id: 6, city: 'Chicago',  month: 'Apr', precip: 3.62 },
  { id: 8, city: 'Chicago',  month: 'Dec', precip: 2.56 },
  { id: 7, city: 'Chicago',  month: 'Aug', precip: 3.98 }
];
utils.table(weather)
    .render();
renderCSV()
Renders Markdown in the cell results
Example
weather = [
  { id: 1, city: 'Seattle',  month: 'Aug', precip: 0.87 },
  { id: 0, city: 'Seattle',  month: 'Apr', precip: 2.68 },
  { id: 2, city: 'Seattle',  month: 'Dec', precip: 5.31 },
  { id: 3, city: 'New York', month: 'Apr', precip: 3.94 },
  { id: 4, city: 'New York', month: 'Aug', precip: 4.13 },
  { id: 5, city: 'New York', month: 'Dec', precip: 3.58 },
  { id: 6, city: 'Chicago',  month: 'Apr', precip: 3.62 },
  { id: 8, city: 'Chicago',  month: 'Dec', precip: 2.56 },
  { id: 7, city: 'Chicago',  month: 'Aug', precip: 3.98 }
];
utils.table(weather)
    .renderCSV();

// "id","city","month","precip"
// "1","Seattle","Aug","0.87"
// "0","Seattle","Apr","2.68"
// "2","Seattle","Dec","5.31"
// "3","New York","Apr","3.94"
// "4","New York","Aug","4.13"
// "5","New York","Dec","3.58"
// "6","Chicago","Apr","3.62"
// "8","Chicago","Dec","2.56"
// "7","Chicago","Aug","3.98"renderMarkdown()
Renders Markdown in the cell results.
Used quite frequently in making the documentation used here.
Example
weather = [
  { id: 1, city: 'Seattle',  month: 'Aug', precip: 0.87 },
  { id: 0, city: 'Seattle',  month: 'Apr', precip: 2.68 },
  { id: 2, city: 'Seattle',  month: 'Dec', precip: 5.31 },
  { id: 3, city: 'New York', month: 'Apr', precip: 3.94 },
  { id: 4, city: 'New York', month: 'Aug', precip: 4.13 },
  { id: 5, city: 'New York', month: 'Dec', precip: 3.58 },
  { id: 6, city: 'Chicago',  month: 'Apr', precip: 3.62 },
  { id: 8, city: 'Chicago',  month: 'Dec', precip: 2.56 },
  { id: 7, city: 'Chicago',  month: 'Aug', precip: 3.98 }
];
utils.table(weather)
    .renderMarkdown();

// id|city    |month|precip
// --|--      |--   |--
// 1 |Seattle |Aug  |0.87
// 0 |Seattle |Apr  |2.68
// 2 |Seattle |Dec  |5.31
// 3 |New York|Apr  |3.94
// 4 |New York|Aug  |4.13
// 5 |New York|Dec  |3.58
// 6 |Chicago |Apr  |3.62
// 8 |Chicago |Dec  |2.56
// 7 |Chicago |Aug |3.98renderTSV()
Renders Markdown in the cell results
Example
weather = [
  { id: 1, city: 'Seattle',  month: 'Aug', precip: 0.87 },
  { id: 0, city: 'Seattle',  month: 'Apr', precip: 2.68 },
  { id: 2, city: 'Seattle',  month: 'Dec', precip: 5.31 },
  { id: 3, city: 'New York', month: 'Apr', precip: 3.94 },
  { id: 4, city: 'New York', month: 'Aug', precip: 4.13 },
  { id: 5, city: 'New York', month: 'Dec', precip: 3.58 },
  { id: 6, city: 'Chicago',  month: 'Apr', precip: 3.62 },
  { id: 8, city: 'Chicago',  month: 'Dec', precip: 2.56 },
  { id: 7, city: 'Chicago',  month: 'Aug', precip: 3.98 }
];
utils.table(weather)
    .renderTSV();

// "id","city","month","precip"
// "1","Seattle","Aug","0.87"
// "0","Seattle","Apr","2.68"
// "2","Seattle","Dec","5.31"
// "3","New York","Apr","3.94"
// "4","New York","Aug","4.13"
// "5","New York","Dec","3.58"
// "6","Chicago","Apr","3.62"
// "8","Chicago","Dec","2.56"
// "7","Chicago","Aug","3.98"reset()
Resets the generator
sort()
Convenience function that creates a sort based on properties.
Sorting always occurs left to right - sort('First', 'Second', etc.)
NOTE: prefixing a field with - will sort it descending.
Example
```
sampleData = [{val: 3}, {val:1}, {val:2}];
new TableGenerator(sampleData)
 //-- sort ascending by the val property
 .sort('val')
 .render();
```sortFn(fn) → {TableGenerator}
Applies a standard array sort function to the data.
Parameters:
| Name | Type | Description |
|---|---|---|
fn |
function | optional sort function |
Returns:
- chainable instance
- Type
- TableGenerator
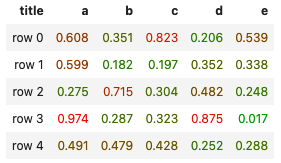
styleCell(formatterFn) → {TableGenerator}
Function that can apply a style to a given cell
(value, columnIndex, rowIndex, row, record) => string
Note: see TableGenerator#styleColumn for another way to do style a cell.
dataSet = [
 { title:'row 0', a: 0.608, b: 0.351, c: 0.823, d: 0.206, e: 0.539 },
 { title:'row 1', a: 0.599, b: 0.182, c: 0.197, d: 0.352, e: 0.338 },
 { title:'row 2', a: 0.275, b: 0.715, c: 0.304, d: 0.482, e: 0.248 },
 { title:'row 3', a: 0.974, b: 0.287, c: 0.323, d: 0.875, e: 0.017 },
 { title:'row 4', a: 0.491, b: 0.479, c: 0.428, d: 0.252, e: 0.288 }
];

// color range from Green to Red
colorRange = new utils.svg.svgJS.Color('#0A0').to('#F00');

//-- only show the temp and source columns
utils.table(dataSet)
  .styleCell(({value, columnIndex, rowIndex, row, record}) => {
    //-- style the color of the cell from Red:0 to Green:1
    // record is the exact record provided to data / the generator
    // row is the array provided to the renderer (which may be re-arranged)
    //   with rowIndex and Column index also relative to the final array
    if (columnIndex >= 1) {
      return `color: ${colorRange.at(value).toHex()}`;
    }
  })
  .render();
When it runs, you will receive a single parameter representing the current cell and row.
Return what the new value should be.
Parameters:
| Name | Type | Description | |||||||||||||||||||||
|---|---|---|---|---|---|---|---|---|---|---|---|---|---|---|---|---|---|---|---|---|---|---|---|
formatterFn |
function | Translation function to apply to all cells. Properties
|
Returns:
- Type
- TableGenerator
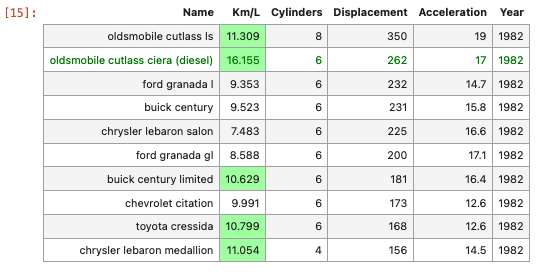
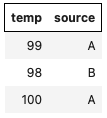
styleColumn(styleObj) → {TableGenerator}
Function that can apply a style to a given column
(rowIndex, ({ columnHeader, columnIndex, record, row, rowIndex, value })) => string
note: see TableGenerator#styleCell for another way to do style a cell.
dataSet = [
  {reg: 'z', source: 'A', temp: 10},
  {reg: 'z', source: 'B', temp: 98},
  {reg: 'z', source: 'A', temp: 100}
];

utils.table(dataSet)
  .styleColumn({
    //-- we want to make the background color of the color red, if the temp > 50
    temp: (temp) => temp > 50 ? 'background-color:pink' : '',

    //-- we want to make the source bold if the source is B
    source: (source) => source === 'B' ? 'font-weight:bold' : ''
  })
  .render();
| reg | source | temp |
|---|---|---|
| z | A | 10 |
| z | B | 98 |
| z | A | 100 |
Or you could style the cell based on information in other columns.
dataSet = [
  {reg: 'z', source: 'A', tempFormat: 'c', temp: 42},
  {reg: 'z', source: 'B', tempFormat: 'f', temp: 98},
  {reg: 'z', source: 'A', tempFormat: 'f', temp: 100}
];

utils.table(dataSet)
  .styleColumn({
    //-- we want to make the background color of the color red, if the temp > 50
    temp: (temp, { record }) => convertToKelvin(temp, record.tempFormat) > 283
      ? 'background-color:pink'
      : ''
  })
  .render();
| reg | source | tempFormat | temp |
|---|---|---|---|
| z | A | c | 10 |
| z | B | f | 98 |
| z | A | f | 100 |
Parameters:
| Name | Type | Description | |||||||||||||||||||||||||||
|---|---|---|---|---|---|---|---|---|---|---|---|---|---|---|---|---|---|---|---|---|---|---|---|---|---|---|---|---|---|
styleObj |
object | object with properties matching the column header label Properties
|
Returns:
- chainable instance
- Type
- TableGenerator
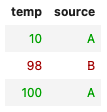
styleHeader(value) → {TableGenerator}
Override the styles for the the header row
Note: this is only used on render / generateHTML currently
dataSet = [{reg:'z', source: 'A', temp: 99},
    {reg: 'z', source: 'B', temp: 98},
    {reg: 'z', source:'A', temp: 100}
 ];

//-- only show the temp and source columns
utils.table(dataSet)
  .columns('temp', 'source') // or .columns(['temp', 'source'])
  .styleHeader('border: 1px solid #000;')
  .render();
Parameters:
| Name | Type | Description |
|---|---|---|
value |
String | style to apply to the table
ex: |
Returns:
- chainable instance
- Type
- TableGenerator
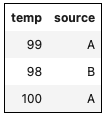
styleRow(styleFn) → {TableGenerator}
Function that can apply a style to a given row
(rowIndex, row, record) => string
dataSet = [{reg:'z', source: 'A', temp: 10},
  {reg: 'z', source: 'B', temp: 98},
  {reg: 'z', source:'A', temp: 100}
];

//-- only show the temp and source columns
utils.table(dataSet)
  .columns('temp', 'source') // or .columns(['temp', 'source'])
  .styleRow(({rowIndex, row, record}) => {
    return (record.source === 'A') ? `color: #0A0;` : `color: #A00`;
  })
  .render();
Parameters:
| Name | Type | Description | ||||||||||||
|---|---|---|---|---|---|---|---|---|---|---|---|---|---|---|
styleFn |
function | Translation function to apply to all cells. When it runs, you will receive a single parameter representing the current cell and row. Return what the new value should be. Properties
|
Returns:
- chainable instance
- Type
- TableGenerator
styleTable(value) → {TableGenerator}
Defines the style to render on the table
Note: this is only used on render / generateHTML currently
dataSet = [{reg:'z', source: 'A', temp: 99},
    {reg: 'z', source: 'B', temp: 98},
    {reg: 'z', source:'A', temp: 100}
 ];

//-- only show the temp and source columns
utils.table(dataSet)
  .columns('temp', 'source') // or .columns(['temp', 'source'])
  .styleTable('border:1px solid #000')
  .render();
Parameters:
| Name | Type | Description |
|---|---|---|
value |
String | style to apply to the table
ex: |
Returns:
- chainable instance
- Type
- TableGenerator
transpose() → {TableGenerator}
Transposes (flips along the diagonal) prior to output.
This can be very handy for wide, but short, tables.
For example, given the data:
const data = [
  { name: 'John', color: 'green', age: 23, hair: 'blond', state: 'IL' },
  { name: 'Jane', color: 'brown', age: 23, hair: 'blonde', state: 'IL' }
];
Running normally would give
utils.table(data)
   .generateMarkdown();
| name | color | age | hair | state |
|---|---|---|---|---|
| John | green | 23 | blond | IL |
| Jane | brown | 23 | blonde | IL |
Running that transposed flips it.
utils.table(data)
 .transpose()
 .generateMarkdown();
| name | John | Jane |
|---|---|---|
| color | green | brown |
| age | 23 | 23 |
| hair | blond | blonde |
| state | IL | IL |
Returns:
- Type
- TableGenerator