This walkthrough is also available as a Jupyter ipynb Notebook - you can run yourself / Alternate Export Version
Perlin / Simplex Noise Visualization
Here we'll try to understand what Perlin Noise and the newer Simplex Noise.
For further detail on the mathematics, I would suggest:
- Adrian B: Understanding Perlin Noise
- Stefan Gustavson's Paper: Understanding Simplex Noise
- Jasper Flick's writeups on PseudoRandom Noise
Both Simplex and Perlin noise are pseudo-random functions that provide a [-1, 1] range values.
(Ultimately the values appear random, but because it is deterministic - if you provide the same input values, you'll get the same values back - it isn't really random)
Simplex provides values at higher dimensions much more easily: O(N^2), and provides a smoother gradient among values.

In this document, we'll be showing the values as they change along the z-axis in an animation, as we move along it based on a function of time - receiving some value between -1 and +1.
fn(x, y, time) => []-1 ... 1]
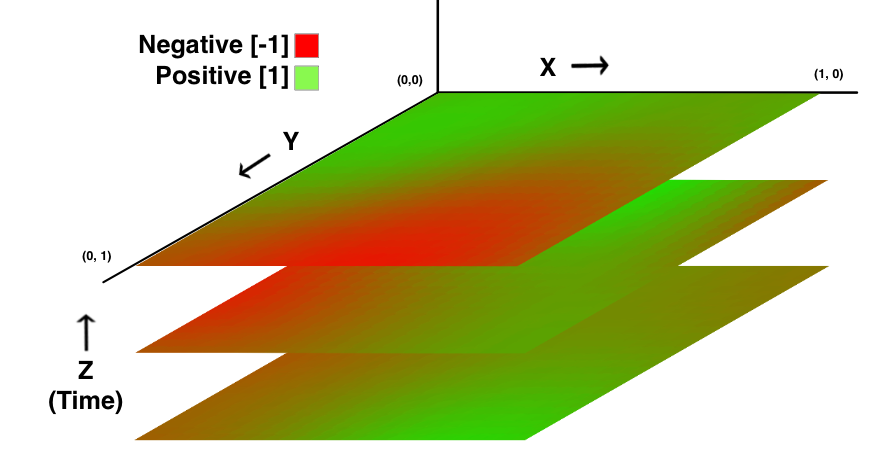
So instead of creating static noise values, we can animate.
This is made a bit clearer if we put a 'spin' where counter clockwise / red is negative, and clock-wise / green is positive values - shown on a 2d grid as we move up and down the z-plane.

Playing around with these values, you can create some very simple but elegant graphics.
See here for a full screen demo
Libraries Used
Note that we use one additional library for simplex noise:
If using NodeJS, there are a few options:
(This was used mostly in generating the SVGs, and simply converting from embed to render ... and removing the calls to window)
utils = require('jupyter-ijavascript-utils')
NoiseJS = require('noisejs').Noise;
noise = new NoiseJS();
['utils', 'noise']
[ 'utils', 'noise' ]
Start / Stop the Animation
As with any animation, it is important to have an ability to stop if unexpected things happen while playing around.
The animation will stop if window.stopAnimation is true.
Executing this cell will tell the animation to restart.
(This is helpful if cancelAnimationFrame isn't supported: see https://caniuse.com/?search=animationFrame)
//-- it is always useful to have some means of stopping animations when exploring

utils.ijs.htmlScript({
    width: 10, height: 10,
    utilityFunctions: { ...utils.svg.utilityFunctions },
    onReady: () => {
        if (window.stopAnimation !== undefined) {
            console.log('restarting animation');
            window.stopAnimation = true;
            window.setTimeout(() => {
                console.log('allowing animation again');
                window.stopAnimation = false;
            }, 500);
        }
    }
});

//-- an alternative option was made available through:
//-- https://jupyter-ijavascript-utils.onrender.com/module-svg_utilityFunctions.html
/*
utils.ijs.htmlScript({

    //-- pack the nodejs functions we want available client side / within javascript
    utilityFunctions: { ...utils.svg.utilityFunctions },

    //-- accept them onReady - see ijs/htmlScript
    onReady: ({ utilityFunctions }) => {
        const animation = utilityFunctions.animationFrameCalls();
        animation.resetAllAnimations();
     }
})
*/
Perlin vs Simplex Noise
Perlin Noise was made by Ken Perlin for the Movie Tron to produce more natural feeling computer generated textures.
Simplex Noise is similar to Perlin Noise, but with the following consequences:
- lower computational complexity and requires fewer multiplications
- scales to higher dimensions (4D, 5D) with much less computational cost: {\displaystyle O(n^{2})}O(n^{2})
- no noticeable directional artifacts
- (although 2d view of 3d noise looks more jagged; getting more jagged with higher dimensions)
- a well-defined and continuous gradient (almost) everywhere
- easy to implement in hardware
For our case we'll be using the Simplex version of noise
Understanding the data
Lets show the values based on how much it fluctuates.
(Here we create a table, executing a function for every row and column, and generate a noise2d value)
{
    const numColumns = 20;
    const numRows = 20;
    const scale = 0.05;

    const colorRange = new utils.svg.svgJS.Color('#F00').to('#0F0');

    new utils.TableGenerator(
        utils.array.size(numRows, (yIndex) =>
            utils.array.size(numColumns, (xIndex) =>
                noise.simplex2(xIndex * scale, yIndex * scale)))
        .reverse()
    )
    .styleCell(({ value }) => `color: ${colorRange.at( value / 2 + 0.5 ).toHex()}`)
    .render();
}
| 0 | 1 | 2 | 3 | 4 | 5 | 6 | 7 | 8 | 9 | 10 | 11 | 12 | 13 | 14 | 15 | 16 | 17 | 18 | 19 |
|---|---|---|---|---|---|---|---|---|---|---|---|---|---|---|---|---|---|---|---|
| -0.424 | -0.382 | -0.345 | -0.31 | -0.272 | -0.225 | -0.168 | -0.1 | -0.021 | 0.064 | 0.15 | 0.222 | 0.261 | 0.251 | 0.185 | 0.072 | -0.068 | -0.205 | -0.313 | -0.366 |
| -0.316 | -0.273 | -0.229 | -0.181 | -0.125 | -0.059 | 0.017 | 0.102 | 0.192 | 0.281 | 0.361 | 0.424 | 0.453 | 0.434 | 0.361 | 0.241 | 0.095 | -0.051 | -0.171 | -0.244 |
| -0.181 | -0.147 | -0.105 | -0.054 | 0.009 | 0.084 | 0.169 | 0.261 | 0.354 | 0.441 | 0.514 | 0.564 | 0.583 | 0.557 | 0.483 | 0.367 | 0.226 | 0.083 | -0.04 | -0.123 |
| -0.031 | -0.015 | 0.012 | 0.053 | 0.11 | 0.181 | 0.263 | 0.352 | 0.44 | 0.519 | 0.581 | 0.619 | 0.628 | 0.601 | 0.534 | 0.432 | 0.308 | 0.178 | 0.063 | -0.017 |
| 0.119 | 0.109 | 0.112 | 0.131 | 0.168 | 0.222 | 0.29 | 0.365 | 0.44 | 0.506 | 0.556 | 0.585 | 0.587 | 0.563 | 0.51 | 0.43 | 0.33 | 0.223 | 0.129 | 0.066 |
| 0.253 | 0.216 | 0.189 | 0.178 | 0.186 | 0.213 | 0.255 | 0.308 | 0.364 | 0.414 | 0.452 | 0.472 | 0.473 | 0.454 | 0.417 | 0.36 | 0.289 | 0.215 | 0.152 | 0.116 |
| 0.355 | 0.292 | 0.236 | 0.194 | 0.17 | 0.165 | 0.177 | 0.203 | 0.236 | 0.267 | 0.29 | 0.303 | 0.303 | 0.292 | 0.269 | 0.236 | 0.197 | 0.158 | 0.133 | 0.13 |
| 0.411 | 0.328 | 0.247 | 0.178 | 0.125 | 0.09 | 0.073 | 0.07 | 0.077 | 0.086 | 0.094 | 0.098 | 0.098 | 0.095 | 0.087 | 0.077 | 0.068 | 0.067 | 0.078 | 0.109 |
| 0.419 | 0.32 | 0.221 | 0.13 | 0.054 | -0.004 | -0.046 | -0.073 | -0.091 | -0.104 | -0.113 | -0.118 | -0.118 | -0.114 | -0.105 | -0.092 | -0.072 | -0.042 | 0.002 | 0.062 |
| 0.383 | 0.273 | 0.161 | 0.056 | -0.034 | -0.108 | -0.166 | -0.212 | -0.25 | -0.282 | -0.307 | -0.321 | -0.321 | -0.309 | -0.285 | -0.25 | -0.205 | -0.148 | -0.079 | -0.001 |
| 0.315 | 0.197 | 0.078 | -0.034 | -0.131 | -0.212 | -0.278 | -0.333 | -0.383 | -0.429 | -0.465 | -0.485 | -0.486 | -0.468 | -0.431 | -0.378 | -0.312 | -0.236 | -0.152 | -0.065 |
| 0.229 | 0.107 | -0.015 | -0.128 | -0.225 | -0.306 | -0.372 | -0.43 | -0.483 | -0.531 | -0.571 | -0.596 | -0.6 | -0.579 | -0.535 | -0.471 | -0.391 | -0.302 | -0.21 | -0.123 |
| 0.144 | 0.018 | -0.105 | -0.216 | -0.31 | -0.385 | -0.446 | -0.497 | -0.543 | -0.586 | -0.625 | -0.655 | -0.666 | -0.65 | -0.606 | -0.536 | -0.448 | -0.352 | -0.258 | -0.177 |
| 0.074 | -0.058 | -0.182 | -0.292 | -0.38 | -0.448 | -0.499 | -0.537 | -0.57 | -0.604 | -0.643 | -0.68 | -0.702 | -0.697 | -0.657 | -0.587 | -0.495 | -0.396 | -0.302 | -0.227 |
| 0.028 | -0.114 | -0.245 | -0.355 | -0.44 | -0.499 | -0.535 | -0.557 | -0.577 | -0.607 | -0.647 | -0.692 | -0.727 | -0.733 | -0.701 | -0.632 | -0.538 | -0.436 | -0.342 | -0.271 |
| 0.006 | -0.152 | -0.294 | -0.409 | -0.492 | -0.541 | -0.562 | -0.571 | -0.584 | -0.612 | -0.656 | -0.708 | -0.753 | -0.77 | -0.744 | -0.676 | -0.579 | -0.471 | -0.374 | -0.305 |
| 0 | -0.178 | -0.336 | -0.46 | -0.541 | -0.58 | -0.591 | -0.593 | -0.604 | -0.633 | -0.68 | -0.737 | -0.788 | -0.811 | -0.788 | -0.718 | -0.614 | -0.498 | -0.393 | -0.318 |
| 0 | -0.198 | -0.372 | -0.504 | -0.584 | -0.619 | -0.627 | -0.629 | -0.642 | -0.673 | -0.723 | -0.781 | -0.832 | -0.854 | -0.829 | -0.753 | -0.638 | -0.509 | -0.39 | -0.303 |
| 0 | -0.21 | -0.395 | -0.535 | -0.618 | -0.655 | -0.668 | -0.676 | -0.694 | -0.729 | -0.779 | -0.834 | -0.879 | -0.893 | -0.858 | -0.77 | -0.641 | -0.494 | -0.356 | -0.25 |
| 0 | -0.214 | -0.404 | -0.546 | -0.635 | -0.681 | -0.704 | -0.722 | -0.748 | -0.786 | -0.834 | -0.883 | -0.916 | -0.915 | -0.863 | -0.757 | -0.609 | -0.442 | -0.283 | -0.154 |
Showing with a Visual Graph
Here is the same data shown as a graph - with values as the size of the circle
{
    const numColumns = 20;
    const numRows = 20;
    const scale = 0.05;
    utils.vega.svg((vl) => vl.markPoint({shape: 'circle', filled: true})
      .data(
        utils.array.size(numRows, (yIndex) =>
            utils.array.size(numColumns, (xIndex) => ({x: xIndex * scale, y: yIndex * scale, val: noise.simplex2(xIndex * scale, yIndex * scale) }))
        ).flat()
      )
      .width(400).height(400)
      .encode(
        vl.x().fieldQ('x'),
        vl.y().fieldQ('y'),
        vl.color().fieldQ('val').legend(null).scale({"range": ["#F00", "#0F0"]}),
        //vl.color().fieldQ('val').legend(null).scale({scheme: 'rainbow'}),
        //vl.angle().fieldQ('val').legend(null), //.scale({domain: [0, 360], range: [-1, 1] })
        vl.size().fieldQ('val').legend(null)
      )
      //.background('black')
    )
}
Looking at the Gradient
Notice that following each of the axes, there is a clear and defined gradient so that the line appears to have a smooth velocity applied - avoiding jerk or jaggedness.
generateNoise = (index, inc, xOffset = 0, yOffset = 0, zOffset = 0) => {
    const val = index * inc;

    return ({
        index,
        xAmt: noise.simplex3(xOffset + val, yOffset, zOffset),
        yAmt: noise.simplex3(xOffset, yOffset + val, zOffset),
        zAmt: noise.simplex3(xOffset, yOffset, zOffset + val)
    });
}

len = 30;
amt = .1;

utils.vega.svgFromSpec({
  "$schema": "https://vega.github.io/schema/vega-lite/v5.json",
  "data": {
    values: utils.array.size(len, (index) => generateNoise(index, amt))
  },
  "repeat": {
    "layer": ["xAmt", "yAmt", "zAmt"]
  },
  "spec": {
    "mark": "line",
    "encoding": {
      "x": {
        "field": "index",
        "type": "quantitative"
      },
      "y": {
        "field": {"repeat": "layer"},
        "type": "quantitative",
        "title": "Value from Noise"
      },
      "color": {
        "datum": {"repeat": "layer"},
        "type": "nominal"
      }
    }
  }
})

Rendering Simplex Noise Directly
The simplest way of looking at an image with Simplex values, is to render it in 2d - usin the x and y pixel positions.
Here we wil also use the and pass that through utilityFunctions (so we can use it in JavaScript).
utilityFunctionscan pass the utils.random.simplexGenerator so we don't need to worry about an external script.datahas the configurable values we can use in the scriptdata.cellSizedictates how 'zoomed in' we are, and [0,0] - [1,1] are shown on screensetCanvasColorhelps to demystify how to paint rgba() to a canvas
utils.ijs.htmlScript({
    width: 400,
    height: 400,
    data: { cellSize: 150, textSize: 15 },
    utilityFunctions: ({ simplex: utils.random.simplexGenerator }),
    html: '<canvas id="draw-target" />',
    onReady: ({ rootEl, options, utilityFunctions, data }) => {
        const canvas = rootEl.querySelector('canvas#draw-target');

        const noise = utilityFunctions.simplex();

        canvas.width = parseInt(options.width);
        canvas.height = parseInt(options.height);

        var ctx = canvas.getContext('2d');

        var image = ctx.createImageData(canvas.width, canvas.height);
        var imageData = image.data;

        function setCanvasColor(index, { red, green, blue, alpha }) {
            imageData[index + 0] = red;
            imageData[index + 1] = green;
            imageData[index + 2] = blue;
            imageData[index + 3] = alpha;
        }

        for (var x = 0; x < canvas.width; x++) {
          for (var y = 0; y < canvas.height; y++) {
            var value = noise.simplex2d(x / data.cellSize, y / data.cellSize) * 256;

            var cell = (x + y * canvas.width) * 4;

            //-- cells are for each pixel
            //-- and in sets of 4: [red, green, blue, alpha]
            setCanvasColor(
                cell,
                {
                    red: value < 0 ? Math.abs(value) : 0,
                    green: value > 0 ? value : 0,
                    blue: 0,
                    alpha: 255
                }
            );
          }
        }

        ctx.fillColor = 'black';
        ctx.fillRect(0, 0, canvas.width, canvas.height);
        ctx.putImageData(image, 0, 0);

        ctx.font = '16px sans-serif'
        ctx.fillStyle = 'white';
        ctx.textAlign = 'left';
        ctx.fillText('(0, 0)', 0, data.textSize);
        ctx.fillText('(1, 0)', data.cellSize, data.textSize);
        ctx.fillText('(0, 1)', 0, data.cellSize + data.textSize);
        ctx.fillText('(1, 1)', data.cellSize, data.cellSize + data.textSize);
    }
});
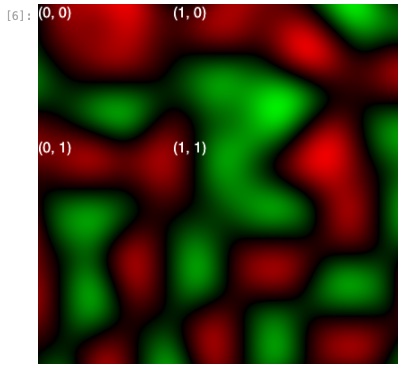
(NOTE: since simplex returns -1 to 1, black means zero, green means how positive, and red means how negative)
Animating
Animating this becomes fairly simple:
- include the
animateparameter inonReady - wrap the code to be run every
frame(repeatedly) in a function (ex:draw) - call
animate(functionName)(oranimate(draw)in this case) to repeatedly execute draw every animation frame - call your
drawfunction once - to start the loop going
utils.ijs.htmlScript({
    width: 400,
    height: 400,

    data: {
        period: 10000,
        cellSize: 150,
        textSize: 15
    },
    utilityFunctions: ({
        simplex: utils.random.simplexGenerator,
        timePeriod: utils.format.timePeriod
    }),
    html: '<canvas id="draw-target" />',
    onReady: ({ rootEl, options, data, utilityFunctions, animate }) => {
        const canvas = rootEl.querySelector('canvas#draw-target');

        const noise = utilityFunctions.simplex();

        canvas.width = parseInt(options.width);
        canvas.height = parseInt(options.height);

        var ctx = canvas.getContext('2d');

        var image = ctx.createImageData(canvas.width, canvas.height);
        var imageData = image.data;

        function setCanvasColor(index, { red, green, blue, alpha }) {
            imageData[index + 0] = red;
            imageData[index + 1] = green;
            imageData[index + 2] = blue;
            imageData[index + 3] = alpha;
        }

        var height = 0;

        function draw() {
          var start = Date.now();
          height = utilityFunctions.timePeriod(data.period);

          for (var x = 0; x < canvas.width; x++) {
            for (var y = 0; y < canvas.height; y++) {
              var value = noise.simplex3d(x / data.cellSize, y / data.cellSize, height) * 256;

              var cell = (x + y * canvas.width) * 4;

              //-- cells are for each pixel
              //-- and in sets of 4: [red, green, blue, alpha]
              setCanvasColor(
                cell,
                {
                  red: value < 0 ? Math.abs(value) : 0,
                  green: value > 0 ? value : 0,
                  blue: 0,
                  alpha: 255
                }
              );
            }
          }

          var end = Date.now();

          ctx.fillColor = 'black';
          ctx.fillRect(0, 0, canvas.width, canvas.height);
          ctx.putImageData(image, 0, 0);

          ctx.font = '16px sans-serif'
          ctx.fillStyle = 'white';
          ctx.textAlign = 'left';
          ctx.fillText('(0, 0)', 0, data.textSize);
          ctx.fillText('(1, 0)', data.cellSize, data.textSize);
          ctx.fillText('(0, 1)', 0, data.cellSize + data.textSize);
          ctx.fillText('(1, 1)', data.cellSize, data.cellSize + data.textSize);

          animate(draw);
        };
        draw();
    }
})
Animation showing the value
Lets try using the current time to calculate two random values:
- direction of the arrow
- length of the arrow
Note that the svg.render uses ijs.htmlScript as its basis,
so we can parameterize the data used in the call within the data option.
Also, the functions are written in node (executed in the Jupyter Lab), but are executed in JavaScript.
Both the data provided, and functions provided on the utilityFunctions are available within the onReady call:
- el - the html element generated for the output already primed for SVG.js
- SVG - the SVG.js library - to support additional matrices, color ranges, etc.
- data - the data object provided to node
- utilityFunctions - the utilityFunctions provided to node
- width - the width provided to the options
- height - the height provided to the options
utils.svg.embed({
    debug: false,

    //-- width of the SVG Scene
    width: 720,
    //-- height of the SVG Scene
    height: 360,
    data: {
        //-- number of indicators along x and y axis
        xCount: 48,
        yCount: 24,
        //-- background color
        backgroundColor: '#FFF',
        //-- color range: 0: startingColor, 1: ending color
        initialColor: '#F0F',
        finalColor: '#0FF',
        //-- how fast or slow the period resets, simplex provides 1 cycle per period
        timePeriod: 10000,
        //-- how closely related the direction and length are in time
        timeOffset: 5000,
        //-- the minimum / maximum lengths of the indicators
        minLength: 10,
        maxLength: 50,
        //-- opacity and width of line
        width: 4,
        opacity: 0.2,
        //-- sensitivity [0 - 1]
        directionSensitivity: 0.8,
        lengthSensitivity: 0.4,
    },

    //-- include the perlin noise library in javascript
    scripts: ['https://cdn.rawgit.com/josephg/noisejs/master/perlin.js'],

    //-- accept the arguments we want passed
    //-- el: html element already setup for SVG.js
    //-- SVG: the SVG.js library (used for ColorRanges, etc.)
    //-- data: the data object above from NodeJS - now in JavaScript
    //-- utilityFunctions: the functions passed from NodeJS - now in JavaScript
    //-- the width and height sent
    //-- see utils.svg.embed for more:
    //-- https://jupyter-ijavascript-utils.onrender.com/module-svg.html
    onReady: ({ el, SVG, data, height, width, utilityFunctions: lib }) => {

        //-- make the background black
        el.node.setAttribute('style', `background-color: ${data.backgroundColor}`);

        const xCount = data.xCount;
        const yCount = data.yCount;

        const xRangeInc = 1 / xCount;
        const yRangeInc = 1 / yCount;

        const xInc = width / xCount;
        const yInc = height / yCount;

        const xMid = width / 2;
        const yMid = height / 2;

        const PI2 = Math.PI * 2;
        // const noiseRange = [-1, 1];

        const colorRange = new SVG.Color(data.initialColor).to(data.finalColor);

        const directionRange = [-data.directionSensitivity, data.directionSensitivity];
        const lengthRange = [-data.lengthSensitivity, data.lengthSensitivity];

        //-- initialize lines
        const lines = lib.size(yCount)
            .map(() => lib.size(xCount, () => el.line()));

        const [ requestAnimationFrame, cancelAnimationFrame ] = lib.animationFrameCalls();

        //-- note that cancel is not supported in all cases
        //-- see https://caniuse.com/?search=animationFrame
        //-- and manual stop below

        if (window.currentAnimation) {
            cancelAnimationFrame(window.currentAnimation);
            window.currentAnimation = null;
        }

        const renderLines = () => {
            //-- render line
            let zDir = lib.mapTime(new Date().getTime(), data.timePeriod);
            let zLen = lib.mapTime(new Date().getTime() + data.timeOffset, data.timePeriod);
            lines.forEach((row, rowIndex) => {
                row.forEach((line, colIndex) => {
                    const valDir = noise.simplex3(colIndex * xRangeInc, rowIndex * yRangeInc, zDir);
                    const dir = lib.mapDomain(valDir, directionRange, [0, PI2]);

                    const valLen = noise.simplex3(colIndex * xRangeInc, rowIndex * yRangeInc, zLen);
                    const len = lib.mapDomain(valLen, lengthRange, [data.minLength, data.maxLength]);
                    const colorC = lib.mapDomain(valLen, lengthRange, [0, 1]);

                    lib.plotLine(line, xInc, yInc, colIndex, rowIndex, dir, len);
                    lib.styleLine(line, colorRange, colorC, data.width, data.opacity);
                })
            });

            //-- stop the animation
            if (window.stopAnimation == true) {
                console.log('stopping animation');
                window.currentAnimation = null;
            } else {
                window.currentAnimation = window.requestAnimationFrame(renderLines);
            }
        };
        renderLines();
    },
    utilityFunctions: {
        plotLine:(line, xInc, yInc, x, y, dir, mag) => {
            const xOff = xInc * x;
            const yOff = yInc * y;
            line.plot(
                xOff,
                yOff,
                xOff + Math.cos(dir) * mag,
                yOff + Math.sin(dir) * mag
            )
        },
        styleLine: (line, colorRange, c, width = 1, opacity = 1) => {
            line.stroke({
                color: colorRange.at(c).toHex(),
                width,
                opacity,
                linecap: 'round'
            });
        },
        //-- see svg/utilityFunctions.animationFrameCalls
        animationFrameCalls: () => {
            const requestAnimationFrame = window.requestAnimationFrame
                || window.mozRequestAnimationFrame
                || window.webkitRequestAnimationFrame
                || window.msRequestAnimationFrame;
            const cancelAnimationFrame = window.cancelAnimationFrame
                || window.mozCancelAnimationFrame;

            return [requestAnimationFrame, cancelAnimationFrame];
        },
        //-- see array.size as an alternative, and simply import it instead
        size: function size(length, defaultValue) {
          if (typeof defaultValue === 'function') {
            return new Array(length).fill(null).map((_, index) => defaultValue(index));
          }
          return  new Array(length).fill(defaultValue);
        },
        //-- see format.mapDomain as alternative, and simply import instead
        mapDomain: (val, [origMin, origMax], [newMin, newMax]) => {
            if (val < origMin) {
              return newMin;
            } else if (val > origMax) {
              return newMax;
            }
            // origMin / val / origMax = newMin / result / newMax
            // (val - origMin) / (origMax - origMin) = (result - newMin) / (newMax - newMin)
            // (val - origMin) * (newMax - newMin) / (origMax - origMin) = result - newMin;
            // (val - origMin) * (newMax - newMin) / (origMax - origMin) + newMin = result
            return (val - origMin) * (newMax - newMin) / (origMax - origMin) + newMin;
        },
        //-- see format.mapPeriod as alternative, and simply import it instead
        mapTime: (t, period) => {
            //-- see format.timePeriod as alternative, and simply import instead
            return t / period;
            // return (t.getTime() % period) / period;
        }
    }
})

(If stopped, run the cell above again, see the section on stopping the animations for more)
Alternative using the library functions
Instead of spelling out the functions, here is the same animation, but importing the library functions into the utilityFunctions.
utils.svg.embed({
    debug: false,

    //-- width of the SVG Scene
    width: 720,
    //-- height of the SVG Scene
    height: 360,
    data: {
        //-- number of indicators along x and y axis
        xCount: 48,
        yCount: 24,
        //-- background color
        backgroundColor: '#FFF',
        //-- color range: 0: startingColor, 1: ending color
        initialColor: '#F0F',
        finalColor: '#0FF',
        //-- how fast or slow the period resets, simplex provides 1 cycle per period
        timePeriod: 10000,
        //-- how closely related the direction and length are in time
        timeOffset: 5000,
        //-- the minimum / maximum lengths of the indicators
        minLength: 10,
        maxLength: 50,
        //-- opacity and width of line
        width: 4,
        opacity: 0.2,
        //-- sensitivity [0 - 1]
        directionSensitivity: 0.8,
        lengthSensitivity: 0.4,
    },
    scripts: ['https://cdn.rawgit.com/josephg/noisejs/master/perlin.js'],
    onReady: ({ el, SVG, data, height, width, utilityFunctions: lib }) => {

        //-- make the background black
        el.node.setAttribute('style', `background-color: ${data.backgroundColor}`);

        const xCount = data.xCount;
        const yCount = data.yCount;

        const xRangeInc = 1 / xCount;
        const yRangeInc = 1 / yCount;

        const xInc = width / xCount;
        const yInc = height / yCount;

        const xMid = width / 2;
        const yMid = height / 2;

        const PI2 = Math.PI * 2;
        // const noiseRange = [-1, 1];

        const colorRange = new SVG.Color(data.initialColor).to(data.finalColor);

        const directionRange = [-data.directionSensitivity, data.directionSensitivity];
        const lengthRange = [-data.lengthSensitivity, data.lengthSensitivity];

        //-- initialize lines
        const lines = lib.size(yCount)
            .map(() => lib.size(xCount, () => el.line()));

        const animationCalls = lib.animationFrameCalls();

        animationCalls.stopOtherAnimations();

        const renderLines = () => {
            //-- render line
            let zDir = lib.timePeriod(data.timePeriod, new Date().getTime());
            let zLen = lib.timePeriod(data.timePeriod, new Date().getTime() + data.timeOffset);
            lines.forEach((row, rowIndex) => {
                row.forEach((line, colIndex) => {
                    const valDir = noise.simplex3(colIndex * xRangeInc, rowIndex * yRangeInc, zDir);
                    const dir = lib.mapDomain(valDir, directionRange, [0, PI2]);

                    const valLen = noise.simplex3(colIndex * xRangeInc, rowIndex * yRangeInc, zLen);
                    const len = lib.mapDomain(valLen, lengthRange, [data.minLength, data.maxLength]);
                    const colorC = lib.mapDomain(valLen, lengthRange, [0, 1]);

                    lib.plotLine(line, xInc, yInc, colIndex, rowIndex, dir, len);
                    lib.styleLine(line, colorRange, colorC, data.width, data.opacity);
                })
            });

            if (animationCalls.checkAnimationsAllowed()) {
                animationCalls.nextAnimationFrame(renderLines);
            }
        };
        renderLines();
    },
    utilityFunctions: {
        plotLine:(line, xInc, yInc, x, y, dir, mag) => {
            const xOff = xInc * x;
            const yOff = yInc * y;
            line.plot(
                xOff,
                yOff,
                xOff + Math.cos(dir) * mag,
                yOff + Math.sin(dir) * mag
            )
        },
        styleLine: (line, colorRange, c, width = 1, opacity = 1) => {
            line.stroke({
                color: colorRange.at(c).toHex(),
                width,
                opacity,
                linecap: 'round'
            });
        },

        //-- see svg/utilityFunctions.animationFrameCalls
        animationFrameCalls: utils.svg.utilityFunctions.animationFrameCalls,

        //-- see array.size as an alternative, and simply import it instead
        size: utils.array.size,

        //-- see format.mapDomain as alternative, and simply import instead
        mapDomain: utils.format.mapDomain,

        //-- see format.mapPeriod as alternative, and simply import it instead
        timePeriod: utils.format.timePeriod
    }
});
(If stopped, run the cell above again, see the section on stopping the animations for more)
X and Y Roll
Alternative version, where instead:
- the X and Y are calculated separately (y being generated on a timeOffset from x)
- the X and Y values are then projected onto cosine and sine respectively
- and then length is determined based on those components
utils.svg.embed({
    debug: false,

    //-- width of the SVG Scene
    width: 720,
    //-- height of the SVG Scene
    height: 360,
    data: {
        //-- number of indicators along x and y axis
        xCount: 48,
        yCount: 24,
        //-- background color
        backgroundColor: '#000',
        //-- color range: 0: startingColor, 1: ending color
        initialColor: '#F0F',
        finalColor: '#0FF',
        //-- how fast or slow the period resets, simplex provides 1 cycle per period
        timePeriod: 10000,
        //-- how closely related the direction and length are in time
        timeOffset: 5000,
        //-- the minimum / maximum lengths of the indicators
        minLength: 10,
        maxLength: 50,
        //-- opacity and width of line
        width: 4,
        // opacity: 0.2, //-- not used
    },
    scripts: ['https://cdn.rawgit.com/josephg/noisejs/master/perlin.js'],
    onReady: ({ el, SVG, data, height, width, utilityFunctions: lib }) => {

        //-- make the background black
        el.node.setAttribute('style', `background-color: ${data.backgroundColor}`);

        const xCount = data.xCount;
        const yCount = data.yCount;

        const xRangeInc = 1 / xCount;
        const yRangeInc = 1 / yCount;

        const xInc = width / xCount;
        const yInc = height / yCount;

        const PI2 = Math.EI * 2;
        const RT2 = Math.sqrt(2);

        const colorRange = new SVG.Color(data.initialColor).to(data.finalColor);

        const lengthRange = data.maxLength - data.minLength;

        //-- initialize lines
        const lines = lib.size(yCount)
            .map(() => lib.size(xCount, () => el.line()));

        const anim = lib.animationFrameCalls();

        anim.stopOtherAnimations();

        const renderLines = () => {
            //-- render line
            const nowMilli = Date.now();
            let zX = lib.timePeriod(data.timePeriod, nowMilli);
            let zY = lib.timePeriod(data.timePeriod, nowMilli + data.timeOffset);

            lines.forEach((row, rowIndex) => {
                row.forEach((line, colIndex) => {
                    //-- we are moving through the zPlane (x, y, z) - based on time
                    const forceX = noise.simplex3(
                        colIndex * xRangeInc,
                        rowIndex * yRangeInc,
                        zX
                    );
                    const forceY = noise.simplex3(
                        colIndex * xRangeInc,
                        rowIndex * yRangeInc,
                        zY
                    );
                    // const length = Math.sqrt(forceX * forceX + forceY * forceY);
                    const length = ( Math.abs(forceX) + Math.abs(forceY) ) / 2;
                    const mappedLength = lib.mapDomain(length, [0, 1], [data.minLength, data.maxLength]);

                    const rotatedX = Math.cos(forceX * Math.PI) * mappedLength;
                    const rotatedY = Math.sin(forceY * Math.PI) * mappedLength;

                    lib.plotLine(line, xInc, yInc, colIndex, rowIndex, rotatedX, rotatedY);

                    const colorC = length; // lib.mapDomain(length, [0, 1], [0, 1]);

                    lib.styleLine(line, colorRange, colorC, data.width, colorC);
                })
            });

            //-- stop the animation
            if (anim.checkAnimationsAllowed()) {
                anim.nextAnimationFrame(renderLines);
            }
        };

        renderLines();
    },
    utilityFunctions: {
        animationFrameCalls: utils.svg.utilityFunctions.animationFrameCalls,
        size: utils.array.size,
        mapDomain: utils.format.mapDomain,
        timePeriod: utils.format.timePeriod,
        clamp: (val, min, max) => {
            if (val < min) {
                return min;
            } else if (val > max) {
                return max;
            }
            return val;
        },

        plotLine: (line, xInc, yInc, x, y, forceX, forceY) => {
            const xOff = xInc * x;
            const yOff = yInc * y;
            line.plot(
                xOff,
                yOff,
                xOff + forceX,
                yOff + forceY
            )
        },
        styleLine: (line, colorRange, c, width = 1, opacity = 1) => {
            line.stroke({
                color: colorRange.at(c).toHex(),
                width,
                opacity,
                linecap: 'round'
            });
        }
    }
});

Alternative Using Canvas
Depending on the number of instances we want to run, using the canvas can be much faster.
(Modifying the dom through setAttribute on SVG can cause Garbage Collection to occur - leading to periodic jutters in the animations).
This also shows how simple it is to extend the ijs.htmlScript to support other libraries, and the simplest example to understand.
//-- could just as use utils.ijs.htmlScript
//-- (as this is how utils.svg.embed is done)

//-- https://jupyter-ijavascript-utils.onrender.com/tutorial-htmlScript.html

utils.ijs.htmlScript({
    debug: true,

    //-- note: width and height can also be set here

    //-- use Canvas instead for the main element
    html: `<canvas />`,

    scripts: [
        'https://cdn.rawgit.com/josephg/noisejs/master/perlin.js',
        //-- we are only using the svg library for the colorRange linear interpolation
        'https://cdn.jsdelivr.net/npm/@svgdotjs/svg.js@3.0.0/dist/svg.min.js'
    ],

    //-- data to prepare the document
    data: {
        canvasWidth: 720,
        canvasHeight: 360,

        //-- number of indicators along x and y axis
        xCount: 48,
        yCount: 24,
        //-- background color
        backgroundColor: '#000',
        //-- color range: 0: startingColor, 1: ending color
        initialColor: '#F0F',
        finalColor: '#0FF',
        //-- how fast or slow the period resets, simplex provides 1 cycle per period
        timePeriod: 10000,
        //-- how closely related the direction and length are in time
        timeOffset: 5000,
        //-- the minimum / maximum lengths of the indicators
        minLength: 10,
        maxLength: 50,
        //-- opacity and width of line
        width: 4,
        // opacity: 0.2, //-- not used
    },

    onReady: ({ rootEl, data, options, utilityFunctions: lib }) => {

        const canvas = rootEl.querySelector('canvas');
        const ctx = canvas.getContext('2d');

        //-- width and height are converted to px (ex: ``${width}px`)
        const width = data.canvasWidth;
        const height = data.canvasHeight;

        //-- make the background black
        canvas.setAttribute('style', `background-color: ${data.backgroundColor}`);
        canvas.width = width;
        canvas.height = height;

        //-- number of inidcators to show
        const xCount = data.xCount;
        const yCount = data.yCount;

        //-- x-y position between 0-1
        const xRangeInc = 1 / xCount;
        const yRangeInc = 1 / yCount;

        //-- how much to increment for each column / row
        const xInc = width / xCount;
        const yInc = height / yCount;

        //-- catch the special case that min and max are the same
        const minMaxMatch = data.min === data.max;

        const colorRange = new SVG.Color(data.initialColor).to(data.finalColor);

        const lengthRange = data.maxLength - data.minLength;

        //-- initialize lines
        const lines = lib.size(yCount, (yIndex) =>
            lib.size(xCount, (xIndex) => ({
                xPos: xIndex * xInc,
                xNoise: xIndex * xRangeInc,
                yPos: yIndex * yInc,
                yNoise: yIndex * yRangeInc
            })))
            .flat();

        const anim = lib.animationFrameCalls();

        anim.stopOtherAnimations();

        const renderLines = () => {
            //-- render line
            const nowMilli = Date.now();
            let zX     = lib.timePeriod(data.timePeriod, nowMilli);
            let zY     = lib.timePeriod(data.timePeriod, nowMilli + data.timeOffset);
            let zColor = lib.timePeriod(data.timePeriod, nowMilli + data.timeOffset + data.timeOffset);

            //-- clear the canvas between frames
            ctx.fillStyle = data.backgroundColor;
            ctx.fillRect(0, 0, width, height);

            for (let lineObj of lines) {
                //-- we are moving through the zPlane (x, y, z) - based on time

                //-- [0 <= x <= 1], [0 <= y <= 1], timePeriod
                const forceX = noise.simplex3(
                  lineObj.xNoise,
                  lineObj.yNoise,
                  zX
                );
                //-- [0 <= x <= 1], [0 <= y <= 1], timePeriod + shift
                const forceY = noise.simplex3(
                  lineObj.xNoise,
                  lineObj.yNoise,
                  zY
                );
                //-- [0 <= x <= 1], [0 <= y <= 1], timePeriod + shift
                const noiseColor = noise.simplex3(
                  lineObj.xNoise,
                  lineObj.yNoise,
                  zColor
                );

                //-- use shortcut to avoid Math.sqrt
                // const length = Math.sqrt(forceX * forceX + forceY * forceY);
                let length = ( Math.abs(forceX) + Math.abs(forceY) ) / 2;
                if (length > 1) length = 1;

                const mappedLength = lib.mapDomain(length, [0, 1], [data.minLength, data.maxLength]);

                const rotatedX = Math.cos(forceX * Math.PI) * mappedLength;
                const rotatedY = Math.sin(forceY * Math.PI) * mappedLength;

                //-- map the color to a place on the colorRange
                const colorVal = lib.mapDomain(noiseColor, [-1, 1], [0, 1]);
                const color = colorRange.at(colorVal);
                //-- note length is used for the alpha
                const colorStr = `rgb(${color.r},${color.g},${color.b},${length})`;

                ctx.strokeStyle = colorStr;
                ctx.lineWidth = minMaxMatch ? data.width : data.width * length;
                ctx.lineCap = 'round';
                ctx.beginPath();
                ctx.moveTo(lineObj.xPos, lineObj.yPos);
                ctx.lineTo(lineObj.xPos + rotatedX, lineObj.yPos + rotatedY);
                // ctx.closePath();
                ctx.stroke();
            }

            //-- stop the animation
            if (anim.checkAnimationsAllowed()) {
                anim.nextAnimationFrame(renderLines);
            }
        };

        renderLines();
    },
    utilityFunctions: {
        animationFrameCalls: utils.svg.utilityFunctions.animationFrameCalls,
        size: utils.array.size,
        mapDomain: utils.format.mapDomain,
        timePeriod: utils.format.timePeriod,
        clamp: utils.format.clampDomain
    }
});
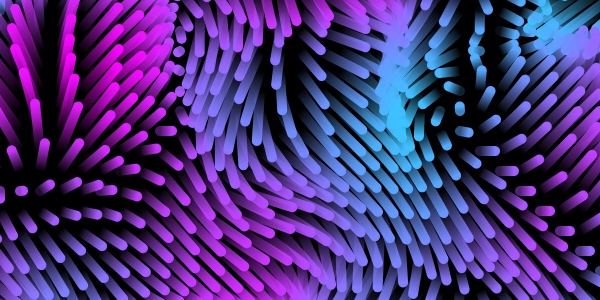
Final Version
- Gradients
- greater opacity near occlusion
- other updates
//-- could just as use utils.ijs.htmlScript
//-- (as this is how utils.svg.embed is done)

//-- https://jupyter-ijavascript-utils.onrender.com/tutorial-htmlScript.html

utils.ijs.htmlScript({
    debug: true,

    //-- note: width and height can also be set here
    width: 720,
    height: 360,

    //-- use Canvas instead for the main element
    html: `<canvas />`,

    scripts: [
        'https://cdn.rawgit.com/josephg/noisejs/master/perlin.js',
        //-- we are only using the svg library for the colorRange linear interpolation
        'https://cdn.jsdelivr.net/npm/@svgdotjs/svg.js@3.0.0/dist/svg.min.js'
    ],

    //-- data to prepare the document
    data: {
        // canvasWidth: 720,
        // canvasHeight: 360,

        //-- number of pixels between indicators
        density: 20,
        //-- background color
        backgroundColor: '#000000',
        //-- color range: 0: startingColor, 1: ending color
        initialColor: '#FF00FF',
        finalColor: '#00FFFF',
        //-- how fast or slow the period resets, simplex provides 1 cycle per period
        timePeriod: 10000,
        //-- how closely related the direction and length are in time
        timeOffset: 5000,
        //-- the minimum / maximum lengths of the indicators
        minLength: 10,
        maxLength: 100,
        //-- opacity and width of line
        width: 10
    },

    onReady: ({ rootEl, data, options, utilityFunctions: lib }) => {

        const canvas = rootEl.querySelector('canvas');
        const ctx = canvas.getContext('2d');

        //-- width and height are converted to px (ex: ``${width}px`)
        const width = Number.parseInt(options.width);// data.canvasWidth;
        const height = Number.parseInt(options.height);// data.canvasHeight;

        //-- make the background black
        canvas.setAttribute('style', `background-color: ${data.backgroundColor}`);
        canvas.width = width;
        canvas.height = height;

        //-- number of inidcators to show
        const xCount = width / data.density;
        const yCount = height / data.density;

        //-- choose the greater of the densities
        const rangeInc = width <= height
            ? 1 / xCount
            : 1 / yCount;

        const xInc = width / xCount;
        const yInc = height / yCount;

        //-- catch the special case that min and max are the same
        const minMaxMatch = data.minLength === data.maxLength;

        const colorRange = new SVG.Color(data.initialColor).to(data.finalColor);

        //-- initialize lines
        const lines = lib.size(yCount, (yIndex) =>
            lib.size(xCount, (xIndex) => ({
                xPos: xIndex * xInc,
                xNoise: xIndex * rangeInc,
                yPos: yIndex * yInc,
                yNoise: yIndex * rangeInc
            })))
            .flat();

        const anim = lib.animationFrameCalls();

        anim.stopOtherAnimations();

        const renderLines = () => {
            //-- render line
            const nowTime = Date.now();
            let zX     = lib.timePeriod(data.timePeriod, nowTime);
            let zY     = lib.timePeriod(data.timePeriod, nowTime + data.timeOffset);
            let zColor = lib.timePeriod(data.timePeriod, nowTime + data.timeOffset + data.timeOffset);

            //-- clear the canvas between frames
            ctx.fillStyle = data.backgroundColor;
            ctx.fillRect(0, 0, width, height);

            for (let lineObj of lines) {
                //-- we are moving through the zPlane (x, y, z) - based on time

                //-- [0 <= x <= 1], [0 <= y <= 1], timePeriod
                const forceX = noise.simplex3(
                  lineObj.xNoise,
                  lineObj.yNoise,
                  zX
                );
                //-- [0 <= x <= 1], [0 <= y <= 1], timePeriod + shift
                const forceY = noise.simplex3(
                  lineObj.xNoise,
                  lineObj.yNoise,
                  zY
                );
                //-- [0 <= x <= 1], [0 <= y <= 1], timePeriod + shift
                const noiseColor = noise.simplex3(
                  lineObj.xNoise,
                  lineObj.yNoise,
                  zColor
                );

                //-- use shortcut to avoid Math.sqrt
                // const forceLength = Math.sqrt(forceX * forceX + forceY * forceY);
                let forceLength = ( Math.abs(forceX) + Math.abs(forceY) ) / 2;
                if (forceLength > 1) forceLength = 1;

                const mappedLength = lib.mapDomain(forceLength, [0, 1], [data.minLength, data.maxLength]);

                const rotatedX = Math.cos(forceX * Math.PI) * mappedLength;
                const rotatedY = Math.sin(forceY * Math.PI) * mappedLength;

                let rotatedLength = (Math.abs(rotatedX) + Math.abs(rotatedY)) / 2;

                let initialTransparency;
                if (minMaxMatch) {
                  //-- we want to see full color circles / no gradient
                  initialTransparency = 1;
                } else {
                  //-- make the gradient appear more opaque if closer to 0
                  //-- as it appears more 'overhead'
                  initialTransparency = lib.mapDomain(
                    rotatedLength,
                    [ 0, data.minLength ],
                    [ 1, 0 ]
                  );
                }

                //-- map the color to a place on the colorRange
                const colorVal = lib.mapDomain(noiseColor, [-1, 1], [0, 1]);
                const color = colorRange.at(colorVal);
                //-- note length is used for the alpha
                // const colorStr = `rgb(${color.r},${color.g},${color.b})`;

                //-- direction of the gradient (x1, y1, x2, y2)
                //-- as it is in the center of the circle
                const gradient = ctx.createLinearGradient(
                    lineObj.xPos, lineObj.yPos,
                    lineObj.xPos + rotatedX, lineObj.yPos + rotatedY
                );
                gradient.addColorStop(0, `rgba(${color.r},${color.g},${color.b},${initialTransparency})`);
                gradient.addColorStop(1, `rgba(${color.r},${color.g},${color.b},1)`);

                        ctx.strokeStyle = gradient;
                ctx.lineWidth = data.width;
                ctx.lineCap = 'round';
                ctx.beginPath();
                ctx.moveTo(lineObj.xPos, lineObj.yPos);
                ctx.lineTo(lineObj.xPos + rotatedX, lineObj.yPos + rotatedY);
                // ctx.closePath();
                ctx.stroke();
            }

            //-- stop the animation
            if (anim.checkAnimationsAllowed()) {
                // anim.nextAnimationFrame(renderLines);
            }
        };

        renderLines();
    },
    utilityFunctions: {
        animationFrameCalls: utils.svg.utilityFunctions.animationFrameCalls,
        size: utils.array.size,
        mapDomain: utils.format.mapDomain,
        timePeriod: utils.format.timePeriod,
        clampDomain: utils.format.clampDomain
    }
});
Test with Vega
Note that something similar to vectors can be shown with vega-lite.
See their Wind Vector Example - shown here / Data Here
utils.vega.svgFromSpec({
  "$schema": "https://vega.github.io/schema/vega-lite/v5.json",
  "description": "Vector array map showing wind speed and direction.",
  "width": 615,
  "height": 560,
  "background": "black",
  "data": {
    "url": "https://vega.github.io/vega-lite/examples/data/windvectors.csv",
    "format": {"type": "csv", "parse": {"longitude": "number", "latitude": "number"}}
  },
  "projection": {"type": "identity"},
  "mark": {"type": "point", "shape": "wedge", "filled": true},
  "encoding": {
    "longitude": {"field": "longitude", "type": "quantitative"},
    "latitude": {"field": "latitude", "type": "quantitative"},
    "color": {
      "field": "dir", "type": "quantitative",
      "scale": {"domain": [0, 360], "scheme": "rainbow"},
      "legend": null
    },
    "angle": {
      "field": "dir", "type": "quantitative",
      "scale": {"domain": [0, 360], "range": [180, 540]}
    },
    "size": {
      "field": "speed", "type": "quantitative",
      "scale": {"rangeMax": 500}
    }
  },
  "config": {
    "aria": false,
    "view": {"step": 10, "fill": "black"}
  }
})

Vega-Lite Projection Alternative
As an alternative to building a map (through projection), we can instead sort by the latitude and longitude values and simply place them on a grid. (Making the process quite a bit simpler)
utils.vega.svg((vl) => vl.markPoint({shape: 'wedge', filled: true})
  .data(vl.csv('https://vega.github.io/vega-lite/examples/data/windvectors.csv').parse({longitude: 'number', latitude: 'number'}))
  .width(600).height(600)
  .encode(
    vl.x().fieldO('longitude').sort('ascending').axis(null),
    vl.y().fieldO('latitude').sort('ascending').axis(null),
    vl.color().fieldQ('dir').legend(null).scale({domain: [0, 360], scheme: 'rainbow'}),
    vl.angle().fieldQ('dir').scale({domain: [0, 360], range: [180, 540]}),
    vl.size().fieldQ('speed').scale({range: [50, 600]}).legend(null)
  )
  .config({view: {step: 11, stroke: null}}) // use 11px steps for x and y scales
  .background('black')
)

Details on Vectors.csv
For anyone curious...
utils.ijs.await(async(display, console) => {
  windVectorsString = await utils.dataset.fetchText('https://vega.github.io/vega-lite/examples/data/windvectors.csv');

  windVectors = windVectorsString.split('\r\n')
    .map(line => line.split(','))
    .slice(1)
    .map(([ longitude, latitude, dir, dirCat, speed]) => ({longitude, latitude, dir, dirCat, speed}));
});
windVectors[0]

// {
//   longitude: '0.125',
//   latitude: '45.125',
//   dir: '228',
//   dirCat: '225',
//   speed: '3.12'
// }