There may be times you would like to leverage client (browser side) technologies, such as d3 to support interaction, or html cavases to render pngs, etc.
This is the purpose of the ijs.htmlScript()
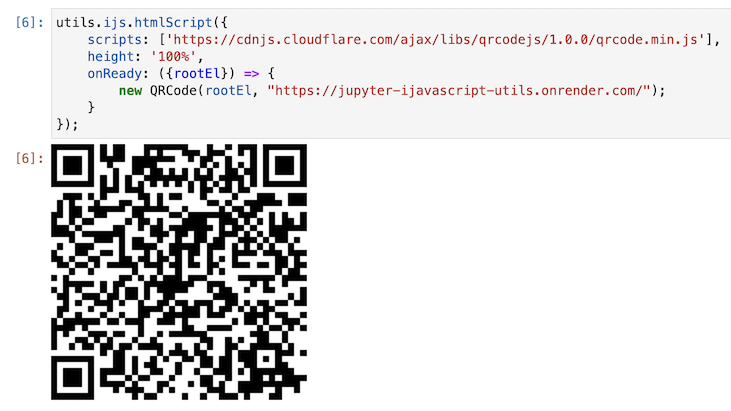
utils.ijs.htmlScript({
    scripts: ['https://cdnjs.cloudflare.com/ajax/libs/qrcodejs/1.0.0/qrcode.min.js'],
    height: '100%',
    onReady: ({rootEl}) => {
        new QRCode(rootEl, "https://jupyter-ijavascript-utils.onrender.com/");
    }
});
Jupyter Notebooks run JavaScript, but within a Node kernel (environment).
In the case for htmlScript, we can serialize the onReady function,
and ensure the dynamic loading of the required scripts are indeed serial,
so we can dependably load javascript in order and then run code in the browser.
Why? When should I Use It?
The purpose of the method is to:
- load javascript / css etc in a dependably serial way.
- (Note that by rendering output, browsers use dynamic html, and therefore may load before scripts, and also do not load in order)
- Execute JavaScript once 'ready'
This was then extended, to support for Leaflet:
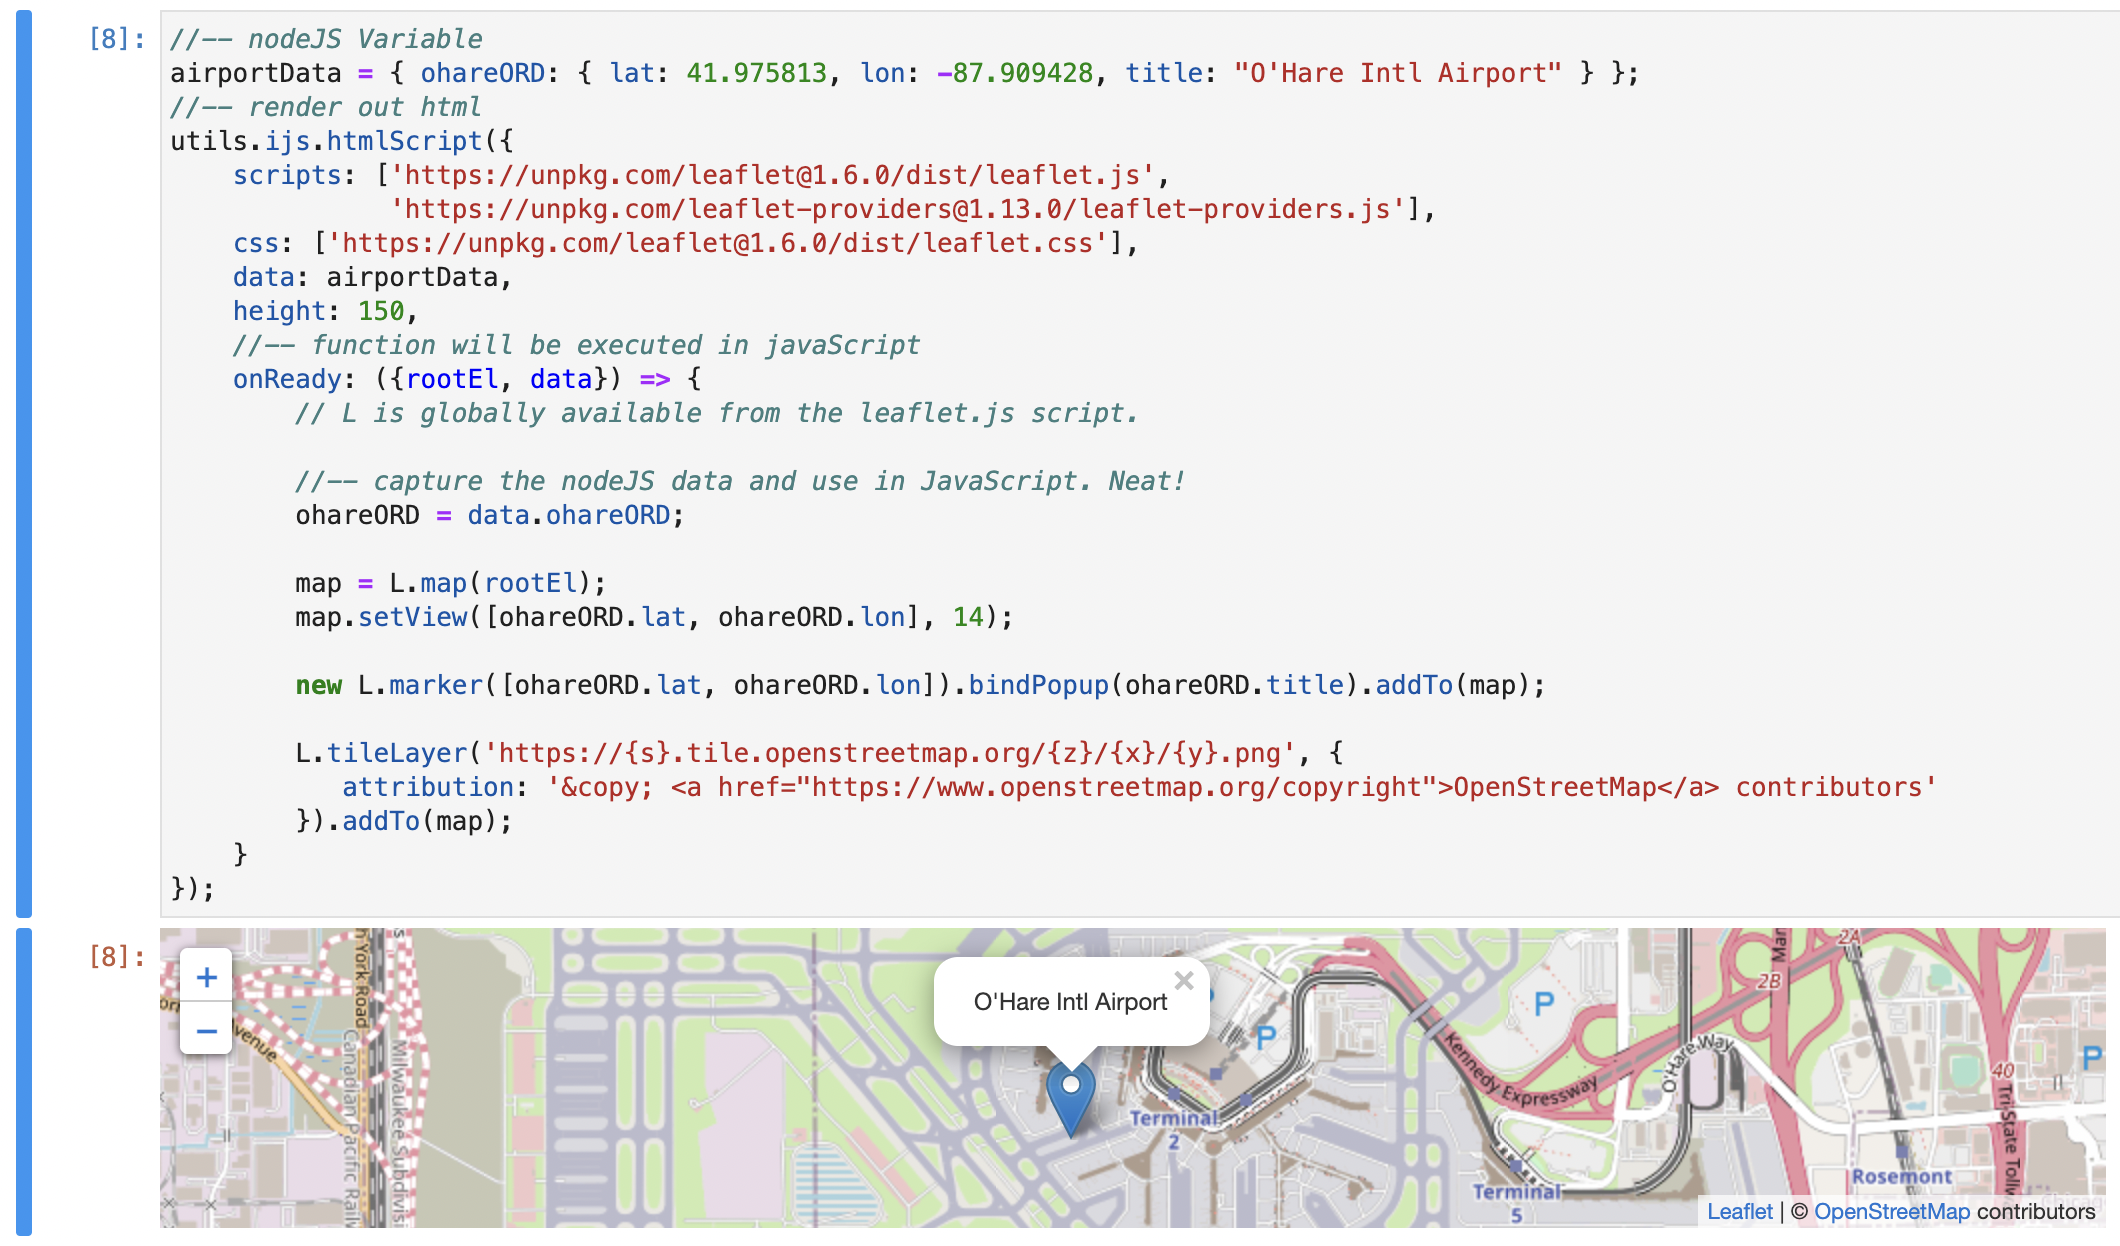
//-- nodeJS Variable
airportData = { ohareORD: { lat: 41.975813, lon: -87.909428, title: "O'Hare Intl Airport" } };
//-- render out html
utils.ijs.htmlScript({
    scripts: ['https://unpkg.com/leaflet@1.6.0/dist/leaflet.js',
              'https://unpkg.com/leaflet-providers@1.13.0/leaflet-providers.js'],
    css: ['https://unpkg.com/leaflet@1.6.0/dist/leaflet.css'],
    data: airportData,
    height: 150,
    //-- function will be executed in javaScript
    onReady: ({rootEl, data}) => {
        // L is globally available from the leaflet.js script.

        //-- capture the nodeJS data and use in JavaScript. Neat!
        ohareORD = data.ohareORD;

        map = L.map(rootEl);
        map.setView([ohareORD.lat, ohareORD.lon], 14);

        new L.marker([ohareORD.lat, ohareORD.lon]).bindPopup(ohareORD.title).addTo(map);

        L.tileLayer('https://{s}.tile.openstreetmap.org/{z}/{x}/{y}.png', {
           attribution: '© <a href="https://www.openstreetmap.org/copyright">OpenStreetMap</a> contributors'
        }).addTo(map);
    }
});
or even D3, and many other libraries.
utils.ijs.htmlScript({
scripts: ['https://cdnjs.cloudflare.com/ajax/libs/d3/7.3.0/d3.min.js'],
height: '100%',
html: '<svg />',
data: [1,2,3,4,5],
onReady: ({rootEl, data, options}) => {
    console.log('d3 loaded' + (typeof d3));

    // set the dimensions and margins of the graph
    const margin = { top: 20, right: 30, bottom: 55, left: 70 },
        width = document.querySelector("body").clientWidth,
        height = 800;

    const svg = d3.select(rootEl.firstChild).attr(
        "viewBox",
        [0, 0, width, height]
    );

    // add title
    svg
        .append("text")
        .attr("x", width / 2)
        .attr("y", margin.top + 2)
        .attr("text-anchor", "middle")
        .style("font-size", "22px")
        .style("text-decoration", "underline")
        .text("Nigeria States Population");

    const x_scale = d3
        .scaleBand()
        .range([margin.left, width - margin.right])
        .padding(0.1);

    const y_scale = d3.scaleLinear().range([height - margin.bottom, margin.top]);

    let x_axis = d3.axisBottom(x_scale);

    let y_axis = d3.axisLeft(y_scale);
    d3
        .json(
            "https://raw.githubusercontent.com/iamspruce/intro-d3/main/data/nigeria-states.json"
        )
        .then(({ data }) => {
            data.forEach((d) => (d.Population = +d.info.Population));

            // Scale the range of the data in the domains
            x_scale.domain(data.map((d) => d.Name));
            y_scale.domain([0, d3.max(data, (d) => d.Population)]);

            // append the rectangles for the bar chart
            svg
                .selectAll("rect")
                .data(data)
                .join("rect")
                .attr("class", "bar")
                .attr("x", (d) => x_scale(d.Name))
                .attr("y", (d) => y_scale(d.Population))
                .attr("width", x_scale.bandwidth())
                .attr("height", (d) => height - margin.bottom - y_scale(d.Population));

            // append x axis
            svg
                .append("g")
                .attr("transform", `translate(0,${height - margin.bottom})`)
                .call(x_axis)
                .selectAll("text")
                .style("text-anchor", "end")
                .attr("dx", "-.8em")
                .attr("dy", ".15em")
                .attr("transform", "rotate(-65)");

            // add y axis
            svg.append("g").attr("transform", `translate(${margin.left},0)`).call(y_axis);
        });
}});

When Not To Use It
NOTE: the iJavaScript team worked very hard on various export formats
Such as:
$$.html(string)- render a string as html in the output$$.svg(string)- render a string as svg directly in the output
etc.
If you simply wish to generate out html and svg and just render it to output,
perhaps the htmlScript isn't needed.
Exploring onReady
The onReady function has a number of values sent to it,
and they are sent by a single object that can be destructured
for easier use.
rootEl- an Html Div Element made special for this render that you can append to and modifydata- this is the serialized data passed in theoptionsto htmlScript - as a simple bridge to pass NodeJS values to your functionscripts- array of javaScript files loaded serially before onReady is calledcss- array of css files to loadhtml- string of html to render within therootElelement, such as<svg />- that could be accessed as rootEl.firstChild for d3width- the css style width to apply to the root divheight- the css style height to apply to the root divdebug- boolean on whether to include adebuggerwithinonReadyto troubleshoot your javascript code.console- boolean on whether to include console statements at the start and end of onReady - to identify if javaScript silently failed.
Here is an example with d3 that uses most of these attributes:
utils.ijs.htmlScript({
scripts: ['https://cdnjs.cloudflare.com/ajax/libs/d3/7.3.0/d3.min.js'],
css: [],
width: '100%',
height: '100%', // or 800 / 800px could also work
html: '<svg />',
data: [1,2,3,4,5],
debug: true,
console: false,
onReady: ({rootEl, data, options}) => {
    console.log('d3 loaded' + (typeof d3));

    // set the dimensions and margins of the graph
    const margin = { top: 20, right: 30, bottom: 55, left: 70 },
        width = document.querySelector("body").clientWidth,
        height = 800;

    const svg = d3.select(rootEl.firstChild).attr(
        "viewBox",
        [0, 0, width, height]
    );

    // add title
    svg
        .append("text")
        .attr("x", width / 2)
        .attr("y", margin.top + 2)
        .attr("text-anchor", "middle")
        .style("font-size", "22px")
        .style("text-decoration", "underline")
        .text("Nigeria States Population");

    const x_scale = d3
        .scaleBand()
        .range([margin.left, width - margin.right])
        .padding(0.1);

    const y_scale = d3.scaleLinear().range([height - margin.bottom, margin.top]);

    let x_axis = d3.axisBottom(x_scale);

    let y_axis = d3.axisLeft(y_scale);
    d3
        .json(
            "https://raw.githubusercontent.com/iamspruce/intro-d3/main/data/nigeria-states.json"
        )
        .then(({ data }) => {
            data.forEach((d) => (d.Population = +d.info.Population));

            // Scale the range of the data in the domains
            x_scale.domain(data.map((d) => d.Name));
            y_scale.domain([0, d3.max(data, (d) => d.Population)]);

            // append the rectangles for the bar chart
            svg
                .selectAll("rect")
                .data(data)
                .join("rect")
                .attr("class", "bar")
                .attr("x", (d) => x_scale(d.Name))
                .attr("y", (d) => y_scale(d.Population))
                .attr("width", x_scale.bandwidth())
                .attr("height", (d) => height - margin.bottom - y_scale(d.Population));

            // append x axis
            svg
                .append("g")
                .attr("transform", `translate(0,${height - margin.bottom})`)
                .call(x_axis)
                .selectAll("text")
                .style("text-anchor", "end")
                .attr("dx", "-.8em")
                .attr("dy", ".15em")
                .attr("transform", "rotate(-65)");

            // add y axis
            svg.append("g").attr("transform", `translate(${margin.left},0)`).call(y_axis);
        });
}});
Animations
Working with Animations is fairly simple with htmlScript.
There is an animation function passed to onReady that works essentially the same as requestAnimationFrame,
although with a few checks to avoid leaks (such as if the cell is re-run)
utils.ijs.htmlScript({
    //-- automatically include a debugger statement
    debug: true,

    //-- initialize the root element with the following html
    html: '<canvas />',

    //-- size of the cell output size / html body (inner elements still need to be sized)
    width: 400,
    height: 300,

    //-- parameterization
    data: {
        period: 5000,
        boxSize: 40
    },
    onReady: ({ rootEl, options, data, utilityFunctions: lib, animate }) => {
        const canvas = rootEl.querySelector('canvas');
        const ctx = canvas.getContext('2d');

        //-- width and height are converted to px (ex: ``${width}px`)
        const width = Number.parseInt(options.width);
        const height = Number.parseInt(options.height);

        //-- set the height of the canvas
        canvas.width = width;
        canvas.height = height;

        const PI2 = Math.PI + Math.PI;
        const midX = width / 2;
        const midY = height / 2;

        const draw = () => {
            const timeEpoch = Date.now();

            //-- use the node function in javascript
            //-- [0-1] every data.period milliseconds;

            //-- see https://jupyter-ijavascript-utils.onrender.com/module-format.html#.timePeriodPercent
            // const periodPercent = (Date.now() % data.period) / data.period;
            const periodPercent = lib.timePeriodPercent(data.period, timeEpoch);

            //-- phase along [0 - 2 PI];
            const periodPi = periodPercent * PI2;

            //-- amount we can move up or down
            const boxRange = (height - data.boxSize) / 2;

            const newY = Math.sin(periodPi) * boxRange;

            //-- x, y, width, height
            const newRect = [
                midX,
                boxRange + newY,
                data.boxSize,
                data.boxSize
            ];

            //-- clear the canvas
            ctx.fillStyle = '#FFFFFF';
            ctx.fillRect(0, 0, width, height);

            //-- draw the box
            ctx.fillStyle = '#000000';
            ctx.fillRect(newRect[0], newRect[1], newRect[2], newRect[3]);

            //-- same as requestAnimationFrame
            //-- automatically detect if the rootEl is no longer detached
            animate(draw);
        }
        draw();
    },
    //-- pass functions from node to be available in javaScript
    utilityFunctions: {
        timePeriodPercent: utils.format.timePeriodPercent
    }
})

Extending HtmlScript
Since onReady is serialized and sent to JavaScript,
you can send nodejs code, and it will execute in JavaScript.
This can make things tricky when trying to extend it multiple times.
In this case, the onReady function can also be passed as a pre-serialized string.
This can allow you to bake in
Considerations:
onReady functions are executed on the Browser / JavaScript
As the onReady code is serialized and run in JavaScript, it will not have access to any variables in nodejs, or Jupyter.
If you need those variables, add them to the options.data attribute.
They'll then be available for your script.
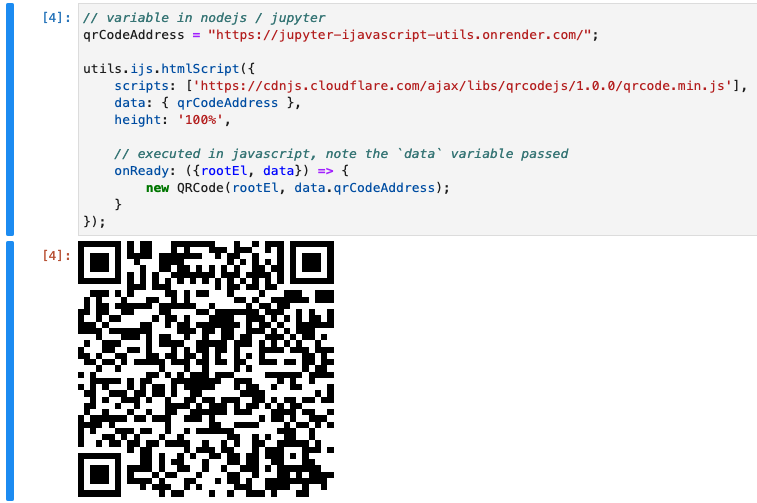
For example:
// variable in nodejs / jupyter
qrCodeAddress = "https://jupyter-ijavascript-utils.onrender.com/";

utils.ijs.htmlScript({
    scripts: ['https://cdnjs.cloudflare.com/ajax/libs/qrcodejs/1.0.0/qrcode.min.js'],
    data: { qrCodeAddress },
    height: '100%',

    // executed in javascript, note the `data` variable passed
    onReady: ({rootEl, data}) => {
        new QRCode(rootEl, data.qrCodeAddress);
    }
});
Order of the Scripts Loaded
Note that Jupyter performs DOM manipulation when executing cells.
Browsers can differ, but most modern browsers (such as chrome and firefox) will behave differently than simply rendering html from a page load.
<script />tags are no longer loaded in sequenc- (This means that if you load
scriptAandscriptB, thenscriptBcannot assumescriptAhas loaded first, making dependent libraries unable to work)
- (This means that if you load
- Inline
<script />tags can also not guarantee the scripts have finished loading.
By using htmlScript options.scripts: [], the order the scripts are specified is the order the scripts are loaded.
You can now safely use dependent libraries, and assume scriptA has finished loading before scriptB is executed. Same for inline scripts.
Browser Isolation is Not Guaranteed
Assume that the scripts loaded in a single notebook share the same global space.
It seems that Jupyter does not isolate cells currently, so don't try to use both d3 v6 and v7 within the same notebook as they might conflict with one another.
Always Load Scripts if an HtmlScript Depends on it
It seems as though the scripts within Jupyter cells are not isolated, so you could technically load a script once, and then run the next htmlScript without loading the script.
However, this is not recommended because you would have no guarantee that the library has finished loading before the following cells are executed.